Sales Rep performance
By clicking on an employee, you get to the employee’s activity details page where you can find a comprehensive collection of data points which help you to determine progress one makes.
What a Sales Rep has been doing
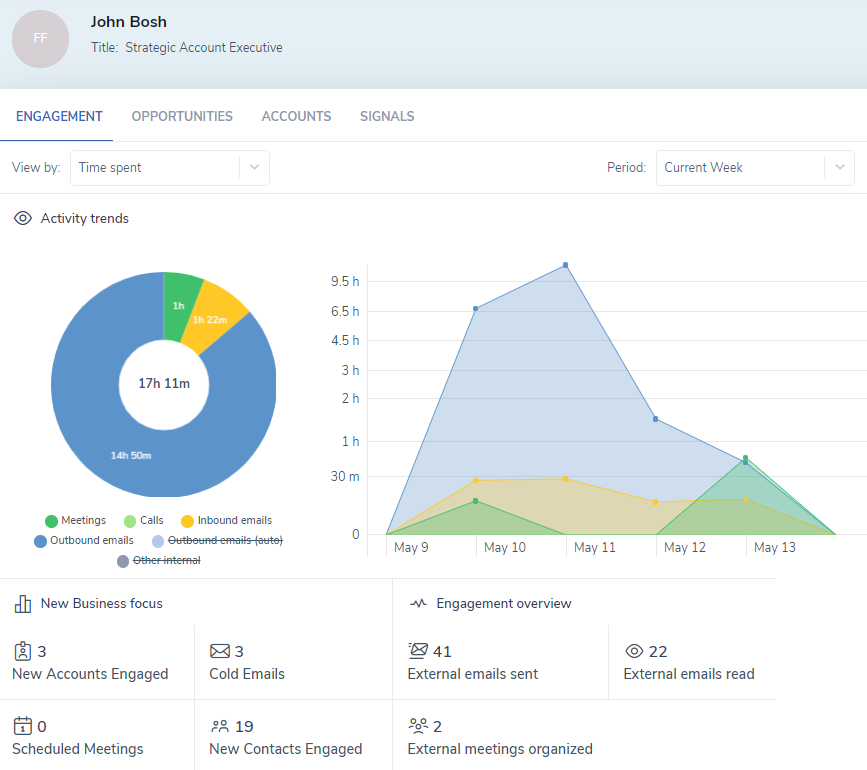
Activity Trend chart shows how much and on what specific day an employee carried out one of the following type of an activity:
- Meetings
- Calls
- Inbound external emails
- Outbound external emails
- Other internal
Note
This data gets gathered automatically from email clients and calendars of employees, no manual entries to CRM are required.
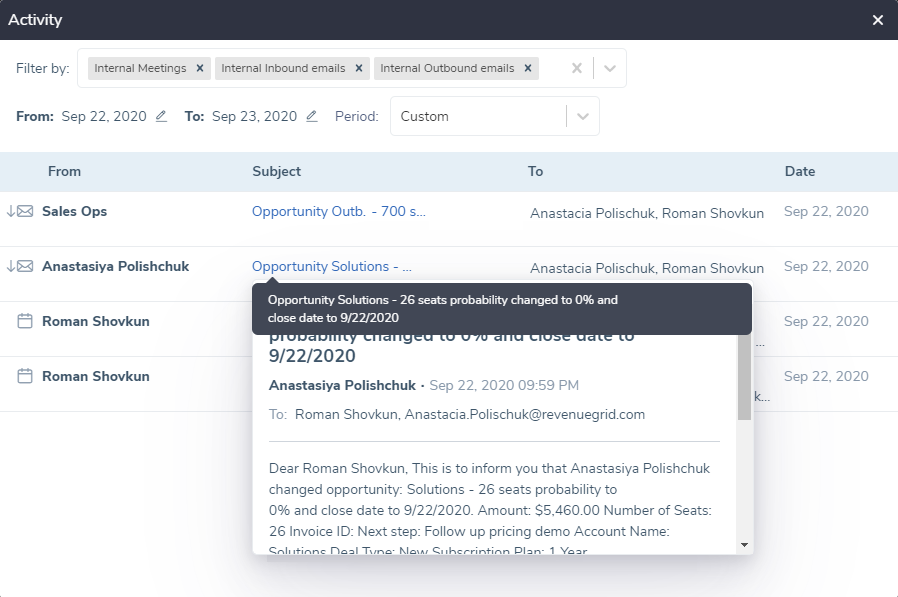
By clicking on each of the data plots on the chart, a pop-up will appear on the screen with details of each record made to the plot.
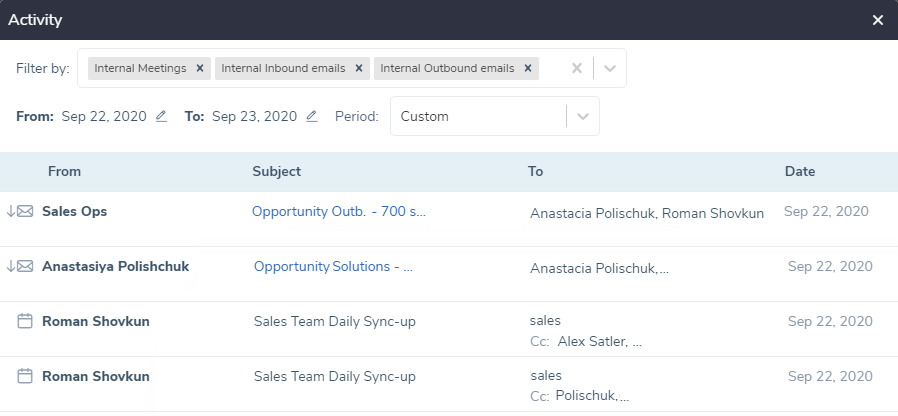
You can drill down all the way to the core of the record. By clicking on a record you are able to read the context of emails, or meetings details, which are being pulled directly from email client and calendars, no data is stored anywhere else.
Review a specific calendar period
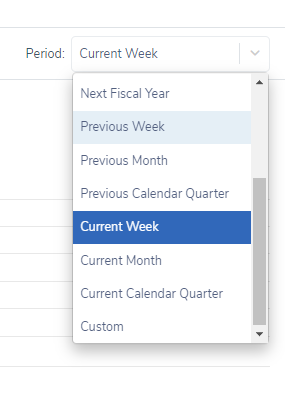 Narrow down the data to period you are reviewing. These periods are similar to what you have set in Salesforce.
Opportunities and Accounts a Sales Rep is accountable for
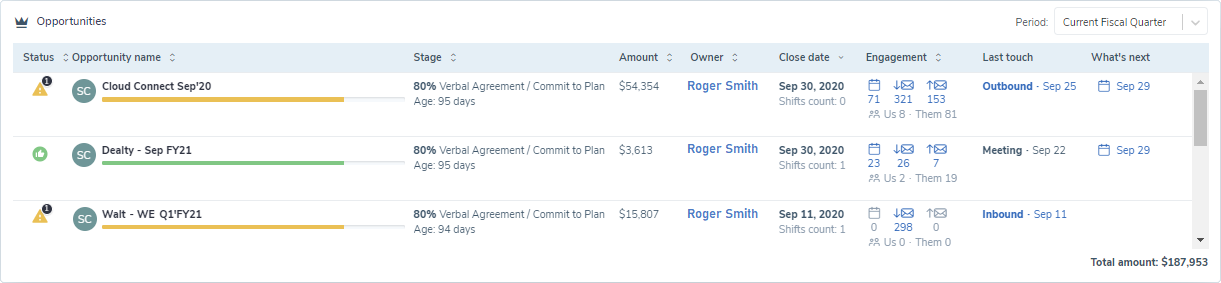
This two subtabs show the opportunities and the accounts which are being run by the employee. For more details per each element of the block, please refer to the Opportunity tab and The Accounts tab articles.
Other achievements
An additional collection of key performance metrics gathered automatically for you to use while evaluating progress made by a Sales representative for the selected period.
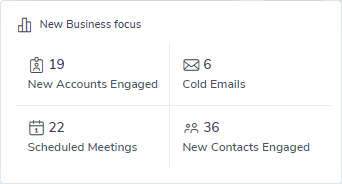
- Number of new accounts engaged, accounts which has never been reach out by the Sales representative
- Number of cold emails sent, reply messages don’t get counted
- Number of scheduled meetings from a calendar of the Sales representative. Already conducted meetings don’t get counted
- Number of new contacts engaged, those who have never been reach out by the Sales representative before
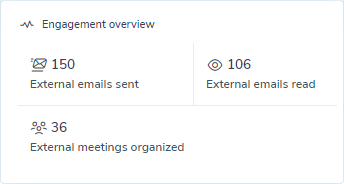
- Number of all external emails sent
- Number of all external emails read
- Number of external meetings scheduled from the Sales representative’s calendars
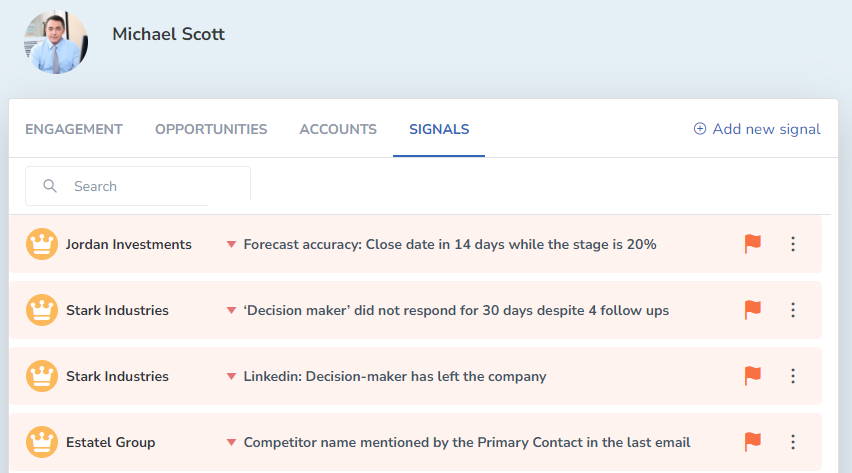
Sales Rep’s signals
This tab shows all active Signals a sales rep has to act upon. It helps Sales Leaders to overview performance of a sales rep by signals he/she has been receiving.
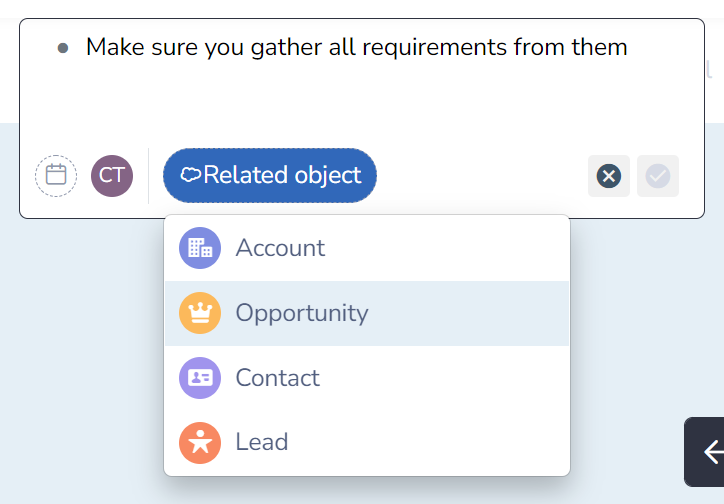
Add a signal for a team member manually
It can be a sales guiding advise or coaching recommendation. Set up notification date to meet deadlines, and link the signal to a Salesforce object for coherence.
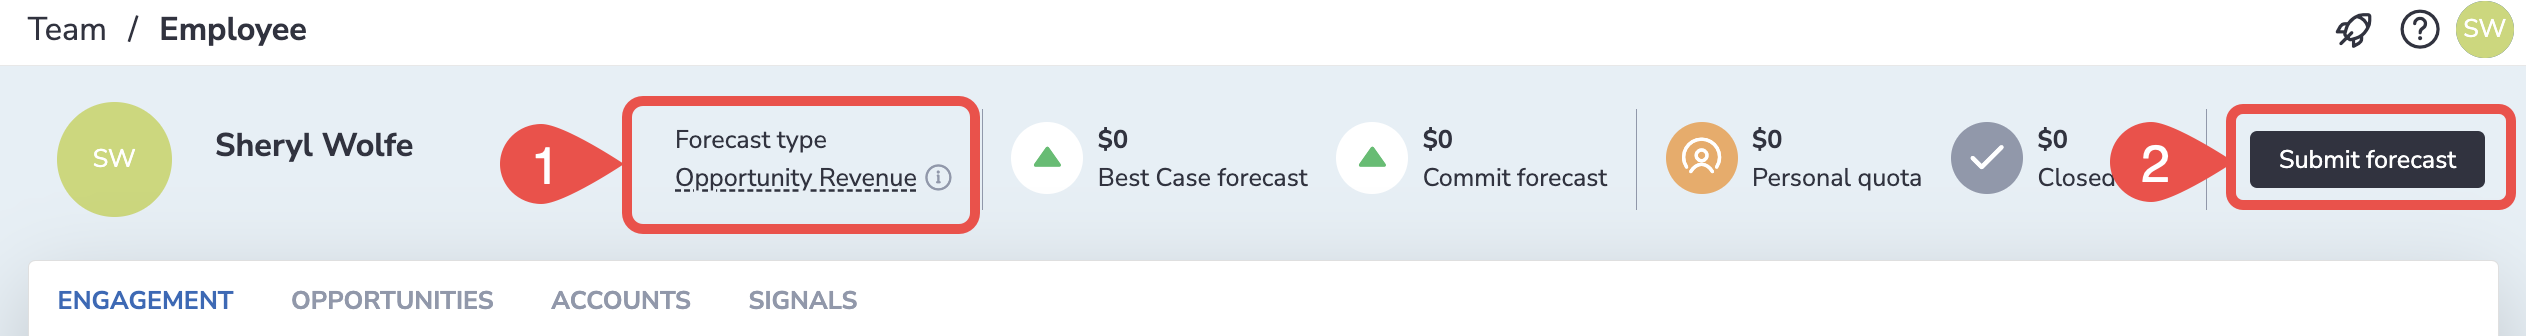
Adjust sales forecast
When sales reps understand that their Best Case and Commit forecasts for the current quarter differ from the ones calculated by Salesforce, they can adjust their personal sales forecast, and see the adjusted numbers in their profile.
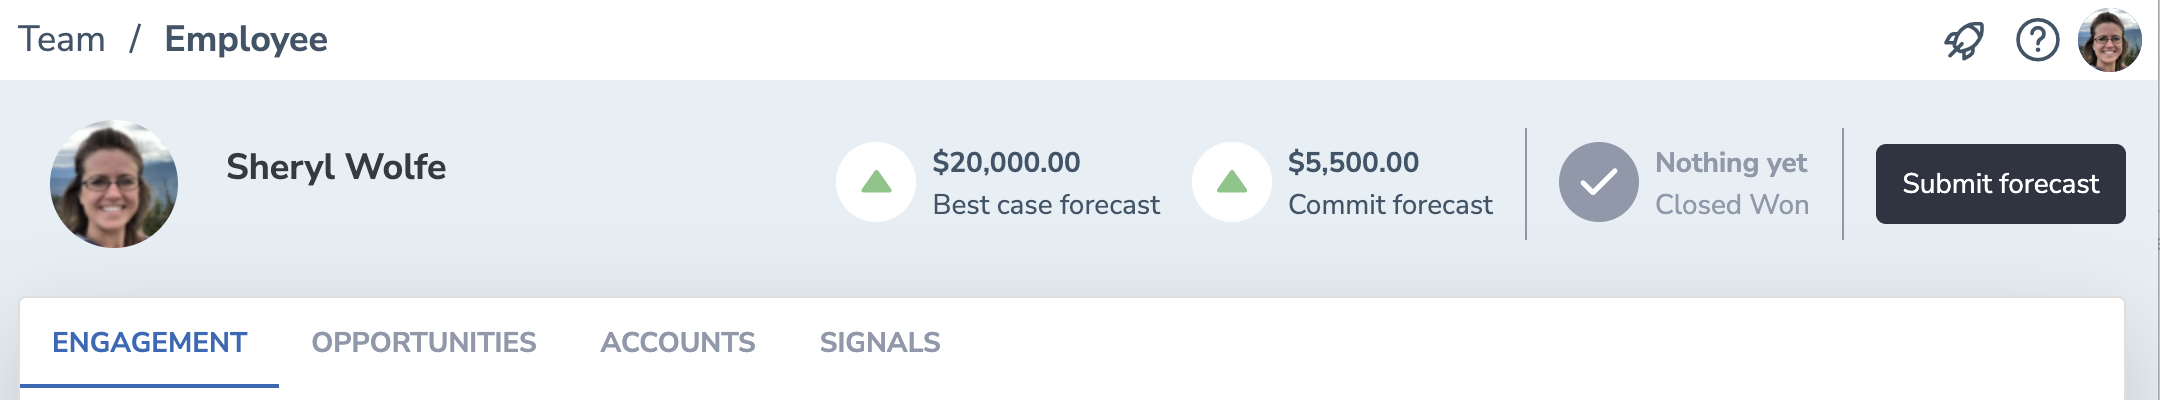
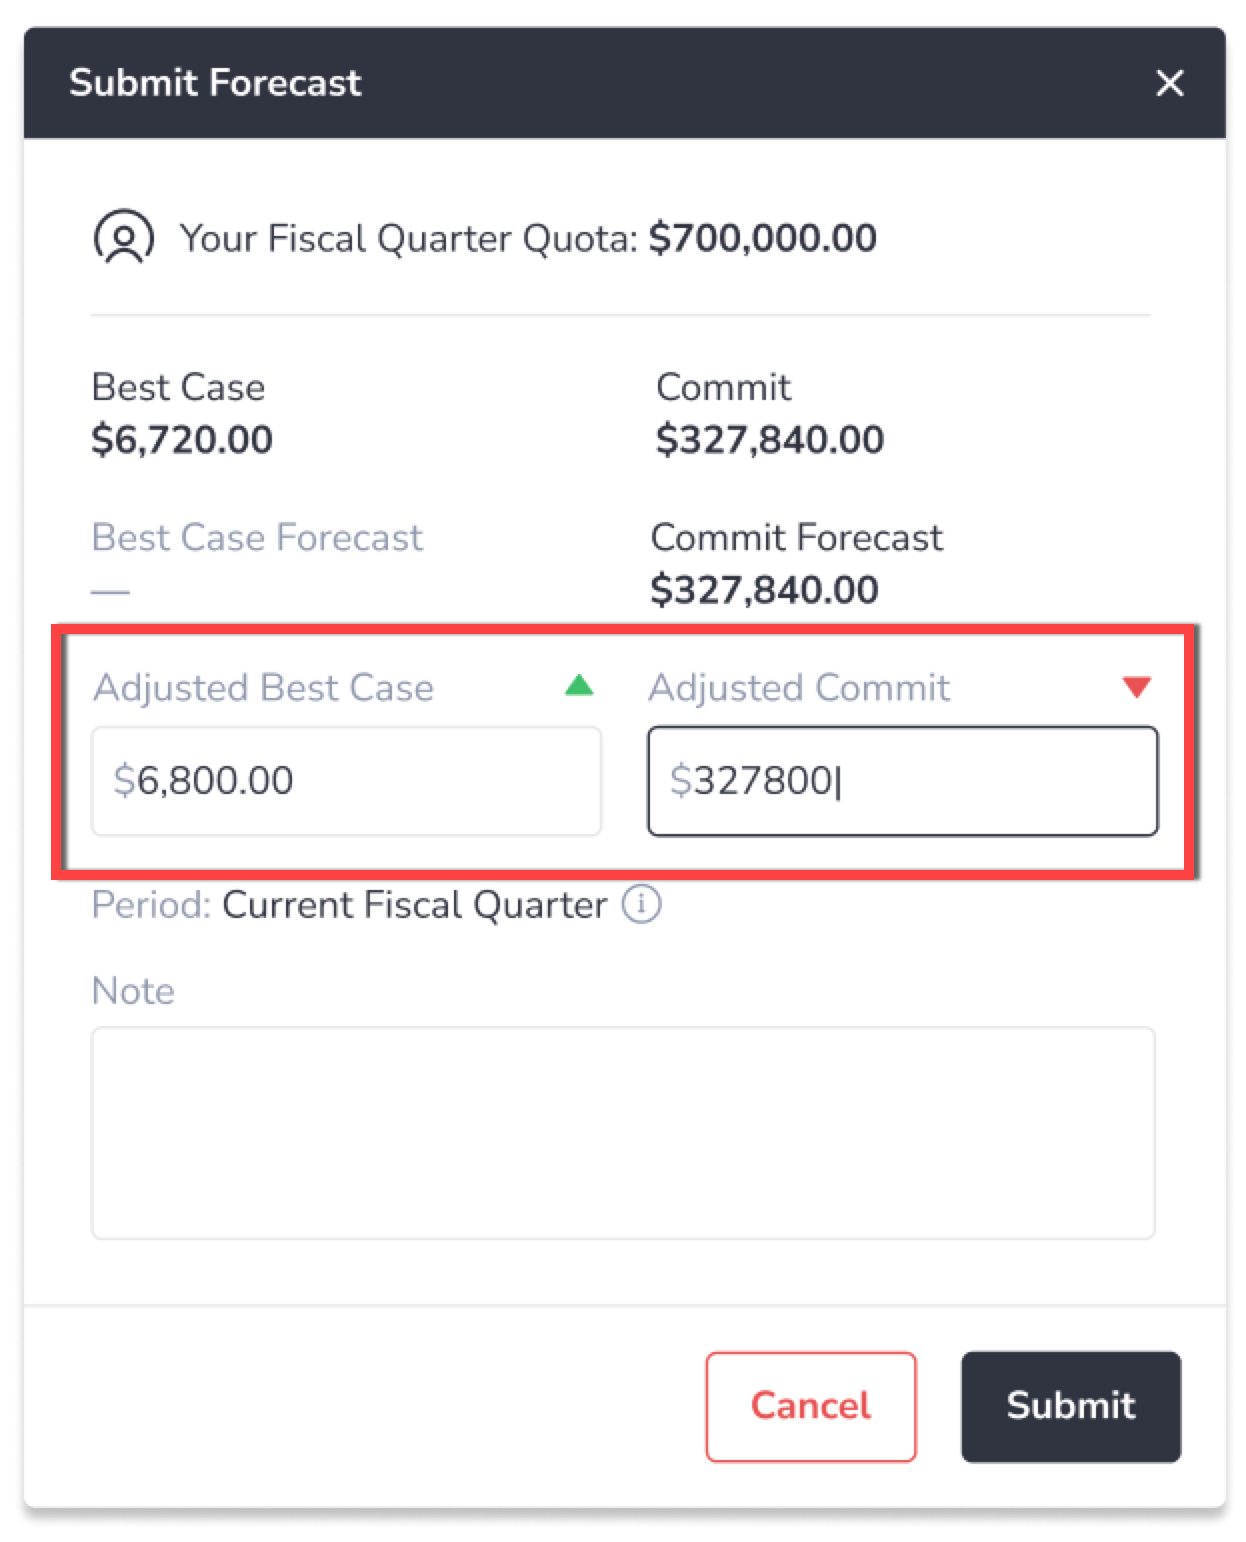
- To adjust the forecast, click Submit forecast.
- In the opened dialog, enter the necessary adjusted Best Case and Commit values in the corresponding fields. This dialog also includes your current quota, Best Case and Commit calculated by Salesforce, the adjusted Best Case and Commit you submitted previously.
- Click Submit to save the changes. The updated numbers will be displayed on the top of the page.
Submit adjusted forecasts for specific forecast types
You can submit your adjusted forecast to a specific forecast type.
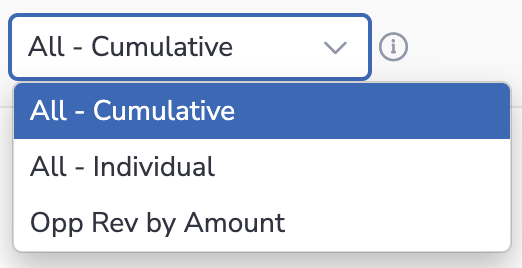
By default, you submit the adjusted forecast for all forecast types (All - Cumulative).
To submit an adjusted forecast for a specific forecast type:
-
Select the necessary forecast type from the Forecast Type drop-down list
-
Click Submit forecast
-
Enter the adjusted Best Case and Commit as described above