Review Your Pipeline on the Opportunities Page
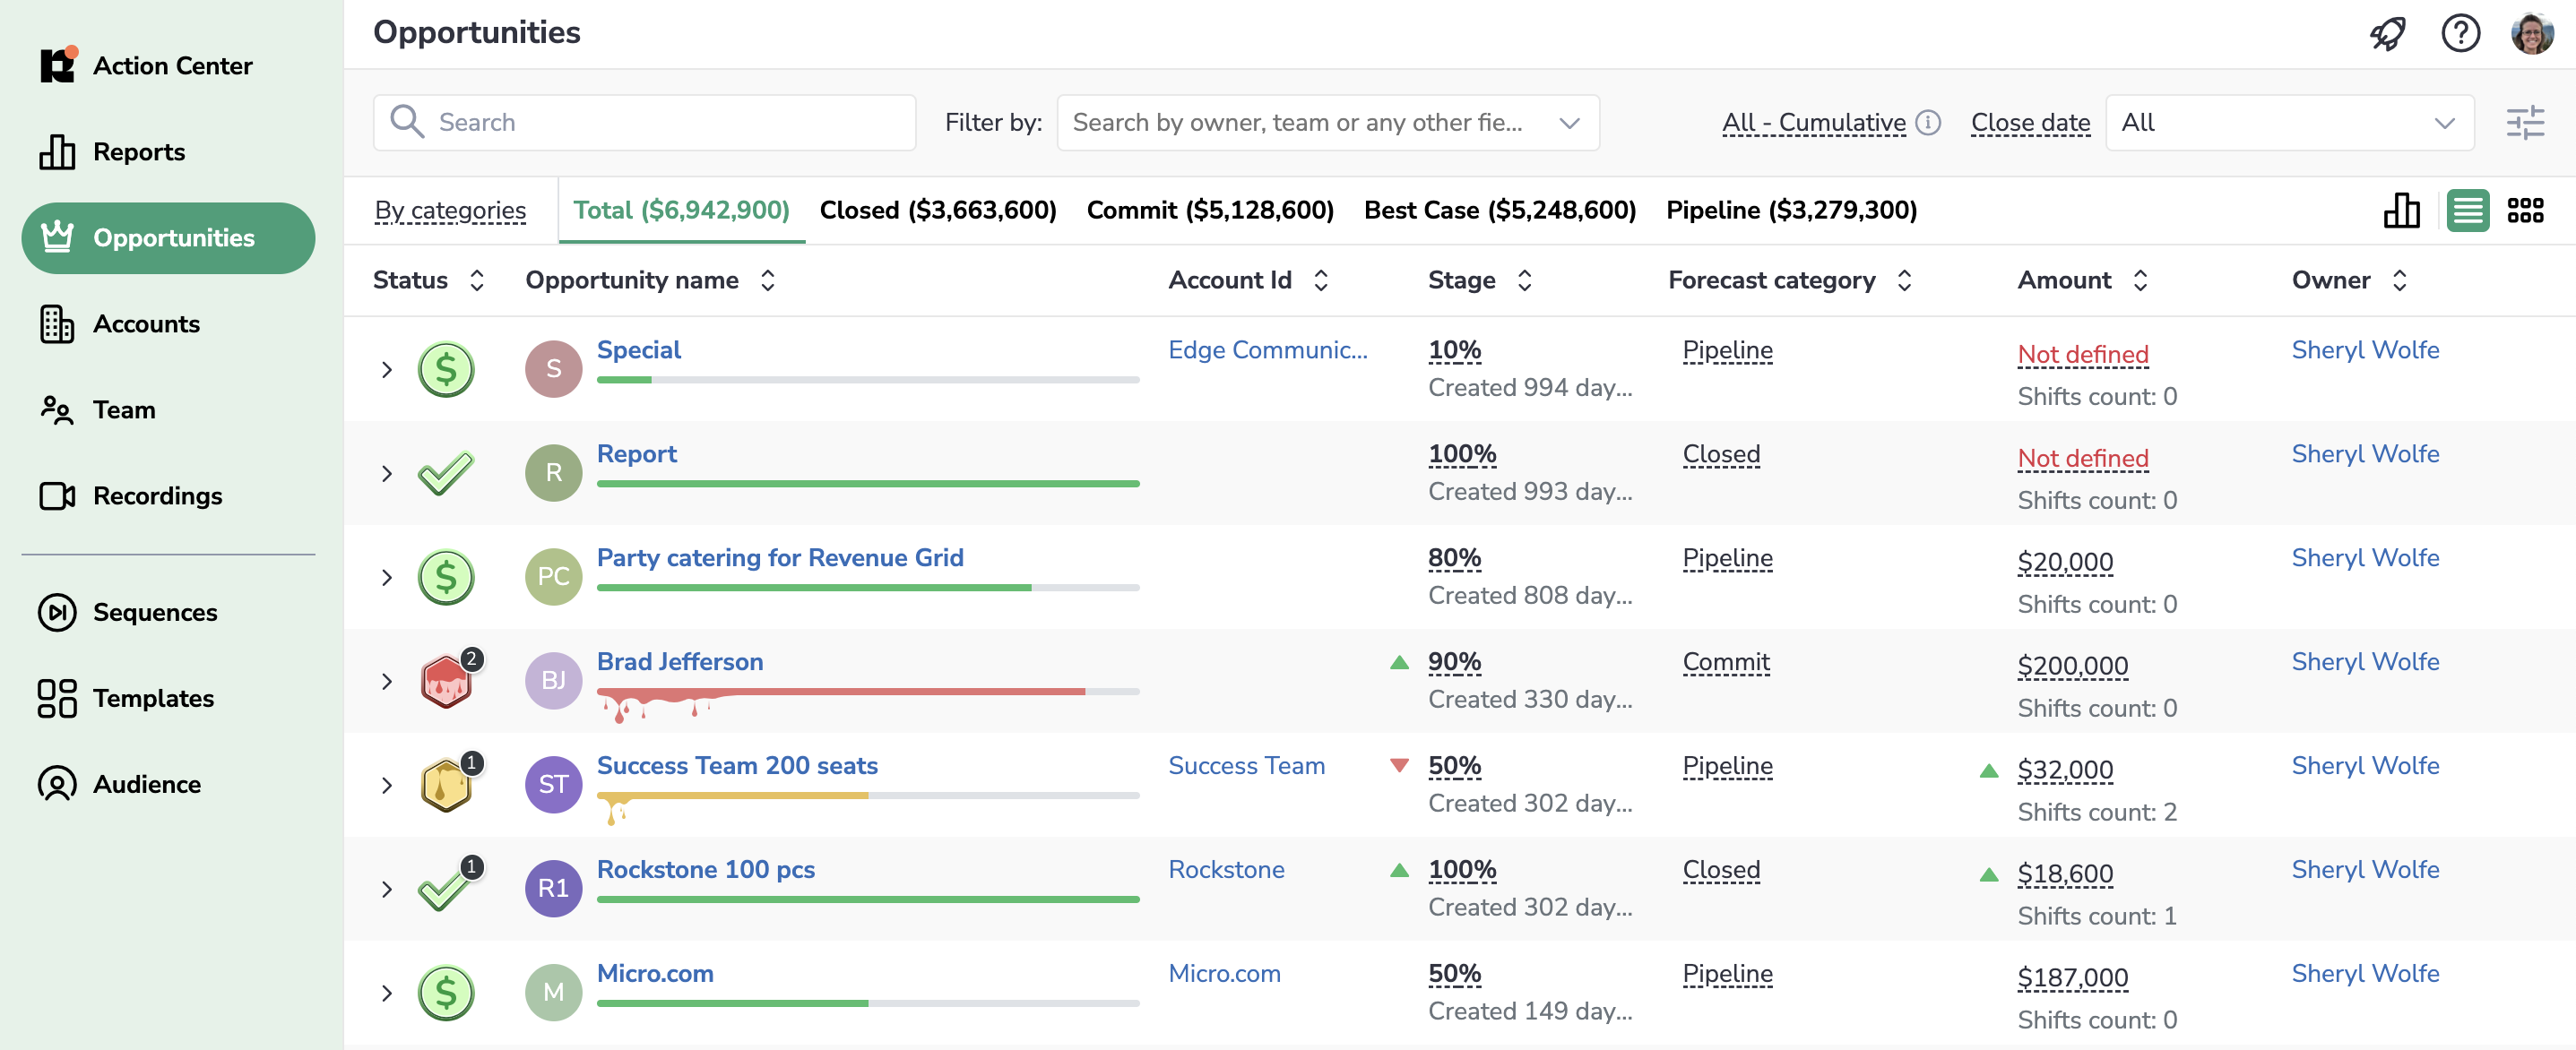
On the Opportunities page, you can visually track and analyze the sales progress of each Opportunity in your pipeline. It consolidates data gathered from Salesforce, email clients, and calendars of all people involved in sales activity in real-time.
Select what Opportunities to display
Before reviewing your team’s Opportunities and how they’re going, make sure that you will see exactly the deals you want to see by specifying the period, forecast type and other filters.
Specify the period
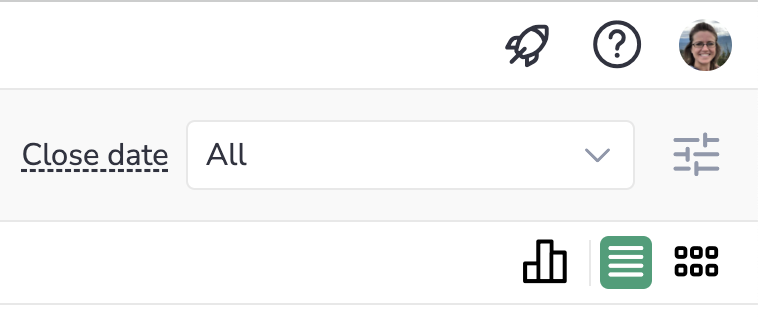
Start by selecting the Period for which you want to see the Opportunities. You can do it by selecting the necessary period in the Close date drop-down list.
Revenue Grid saves your choice and the next time you open this page you won’t need to configure the selection again, you can just continue where you left.
Customize Opportunities filtering by specific dates
You can configure the custom dates for displaying the relevant Opportunities.
To select the custom dates for filtering:
 1. In the upper right-hand corner, click on Close Date drop-down list
2. Select the Custom option
3. In the From field, select the start date for showing Opportunities
4. In the To field, select the end date for showing Opportunities
Select forecast type to display the Opportunities
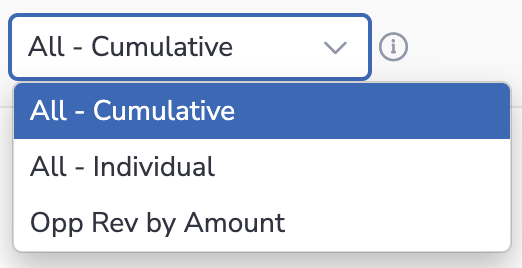 If your company uses Forecast types, select any of them in the drop-down list next to the Close date field. You will only see the Opportunities that belong to the selected forecast type.
By default, Opportunities from all forecast types are displayed on this page (All - Cumulative), but you can select any Opportunity-based forecast type in the upper-right part of this page.
Learn about setting up forecast types in Salesforce…
Filter to narrow down the list
 You can filter down the Opportunities by a number of criteria, like Close date, Create date, Age of Opportunities, Owner, etc.
Basically, you can filter by any Salesforce field on an Opportunity object, including your custom fields.
You can also filter by unique criteria, such as Opportunities that haven’t had in/outbound emails, nor meetings for the recent period.
Add/hide columns
 You can customize what columns displayed on this page using the columns icon in the upper right-hand corner of the screen.
See the total pipeline and forecast figures
The area above the table contains statistics about the period you selected: the Opportunities distribution among the forecast categories or stages.
Hover over a figure to see a tooltip specifying the percent, total amount, and number of opportunities that are healthy, need attention or are at risk, and whether any of these figures changed over last 6 days.
If you click on any figure to see the list of Opportunities that are in the Commit category.
By switching to the Total tab, you get back to the list of all Opportunities.
Switch between Opportunity view modes
You can change the view mode using the drop-down list in the upper left-hand corner of the table.
Currently, two view modes are available:
By categories: the Opportunities are distributed according to the Salesforce forecast category they belong to: Closed, Commit, Best Case, Pipeline.
By stages: the Opportunities are distributed according to the stages they are in.
Use the tabs at the top of the Opportunities list table to switch between different stages.
Track the team’s average statistics
At the top of the pipeline page, there is a statistics bar that displays your team’s overall sales performance, providing a useful tool for planning and assessing your sales process.

For example, using this bar, you can predict how many more Opportunities you need to close to hit your Quota this quarter or plan how many deals you need to close next quarter to increase revenue.
Monitor your Opportunities’ status
You can quickly identify how an Opportunity is progressing towards its close date with color coding.
Depending on its total score, an Opportunity is assigned a color that visualizes how it’s going:
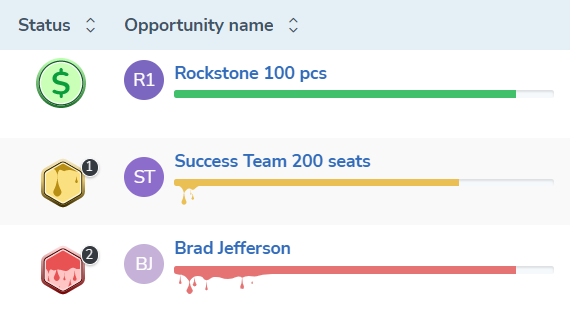
- Green (0+ ) – the Opportunity is healthy and is going well
- Yellow (from -1 to -30) – the Opportunity needs attention
- Red (-31 and less) – the Opportunity is at risk of being lost
By default, when an Opportunity is just created or there are no related signals, its status is set to Green (healthy).
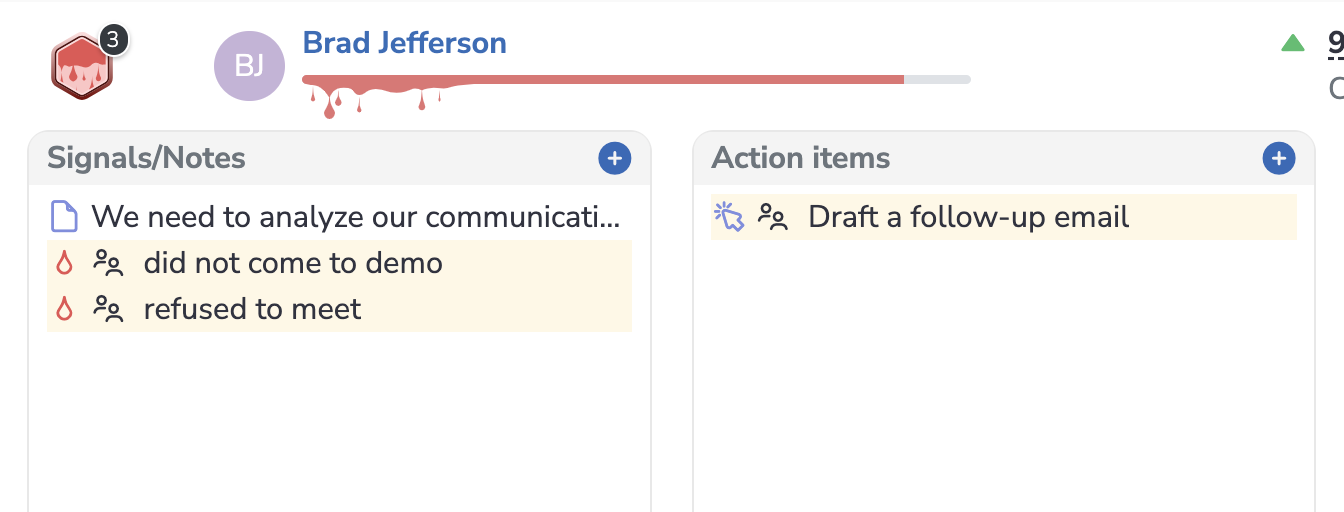
View all Opportunity details
Click on an Opportunity to expand it and see the most important highlights about this Opportunity:
-
Related signals, notes, and action items
-
Last touch: meetings, inbound, and outbound emails
-
What’s coming next: scheduled meetings, description, and next step
Expand or collapse all Opportunities using the mode icons in the upper right-hand corner of the table.
You can also see monitor the changes in Opportunities close dates, amounts, and stages using the color indicators:
![]() Green icon means a positive change such as increase in amount, shifting close date to an earlier date.
Green icon means a positive change such as increase in amount, shifting close date to an earlier date.
![]() Red icon means a negative change such as decrease in amount, shifting close date to a later date, or degradation to a lower stage.
Red icon means a negative change such as decrease in amount, shifting close date to a later date, or degradation to a lower stage.
To review the changes history of these fields, hover over the necessary figure.
How much negotiation has taken place
The Team engagement column shows a number of activities in communication with Opportunities.
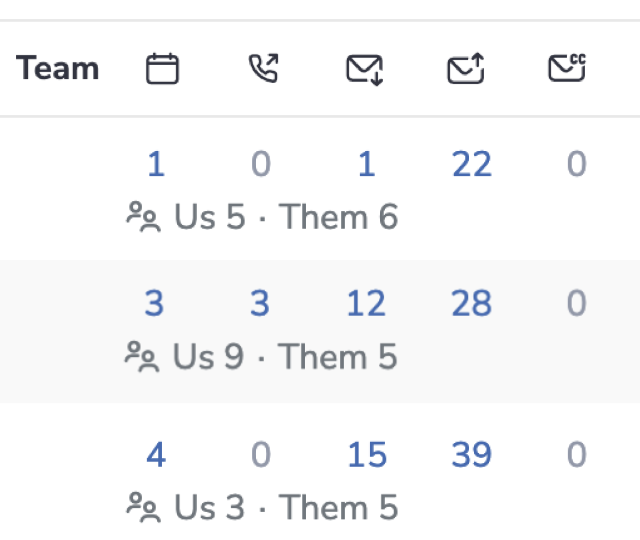
![]() Meetings
Meetings
![]() Calls
Calls
![]() Inbound emails
Inbound emails
![]() Outbound emails
Outbound emails
 Number of representatives participated in meetings and have been involved into the correspondence.
You can sort Opportunities by number of meetings, calls inbound emails, and outbound emails by clicking on the corresponding icon.
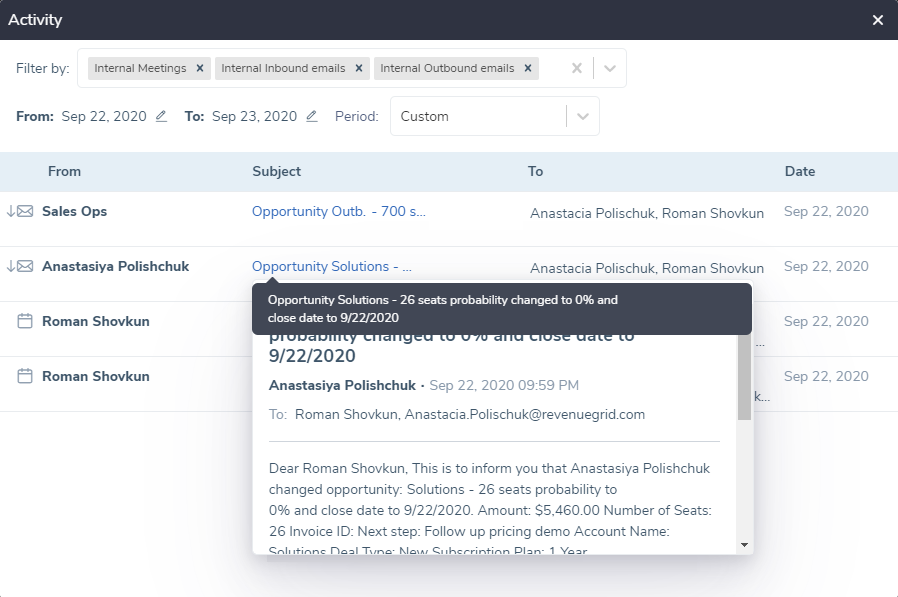
Review communication details
Click on a figure to see a pop-up dialog with details of each record comprising the total number.
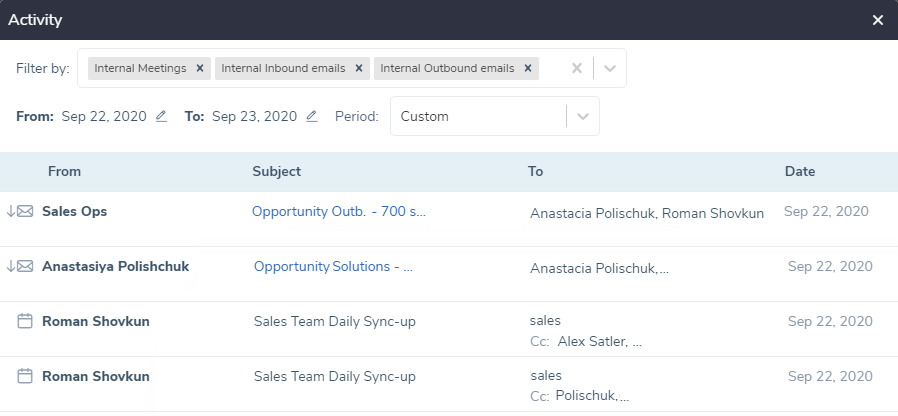
By clicking on a record, you can read the actual context of emails or meeting details. This data is retrieved directly from email clients and calendars and is not stored in Revenue Grid.
Confidentiality matters
Sensitive information will be hidden from users who are not supposed to see it.
A user can see the content of an email only if the user is: - the sender or is among recipients - the person’s manager in Salesforce role hierarchy
When was the last touch with an Opportunity
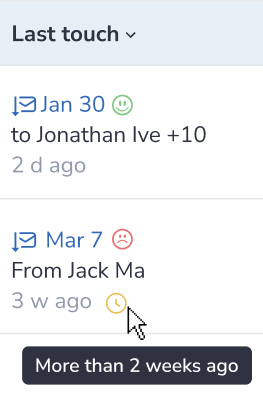
In this column, you can review the most recent touch with Opportunity.
Our sentiment analysis will mark every inbound email on the spectrum  from very negative to very positive.
By clicking on the date, you can review the context of an email or meeting details.
If the last touch took place more than 2 weeks ago, such last touch is marked with a yellow clock icon  to grasp your attention.
What is the next step
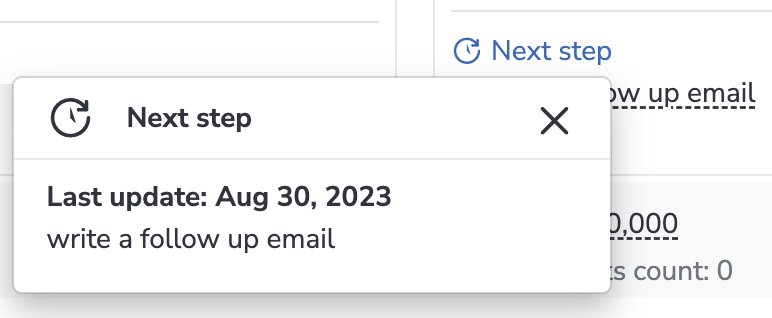
The next step is automatically retrieved from Salesforce if the corresponding field is filled in.
Revenue Grid also analyses the Sales Representatives’ calendars to identify any future scheduled meetings with their Opportunities and fills in the next step with any future events.
Sales Reps can add the Next step right in the Opportunity table. It will be automatically synced to Salesforce.
Manage your Opportunities
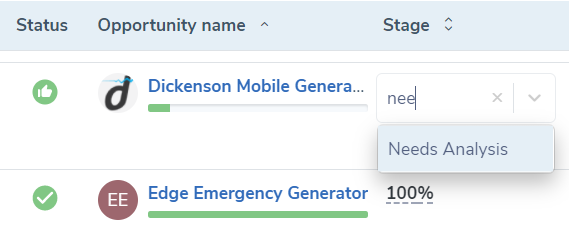
Update Opportunity stage
To change an Opportunity stage:
- Click on the corresponding row of Stage column
- Select the necessary stage from the drop-down list
Update Close date
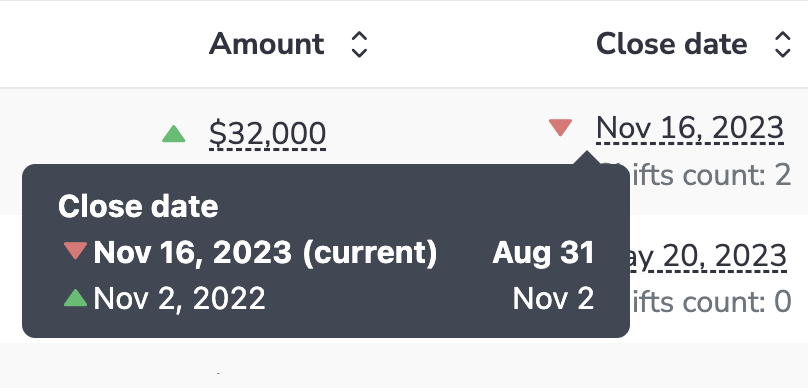 Click on the close date to edit it.
Hover over the close date to see how many times the close date has been shifted and whether the last shift was positive or negative.
Click on the close date to edit it.
Hover over the close date to see how many times the close date has been shifted and whether the last shift was positive or negative.
Update Forecast category
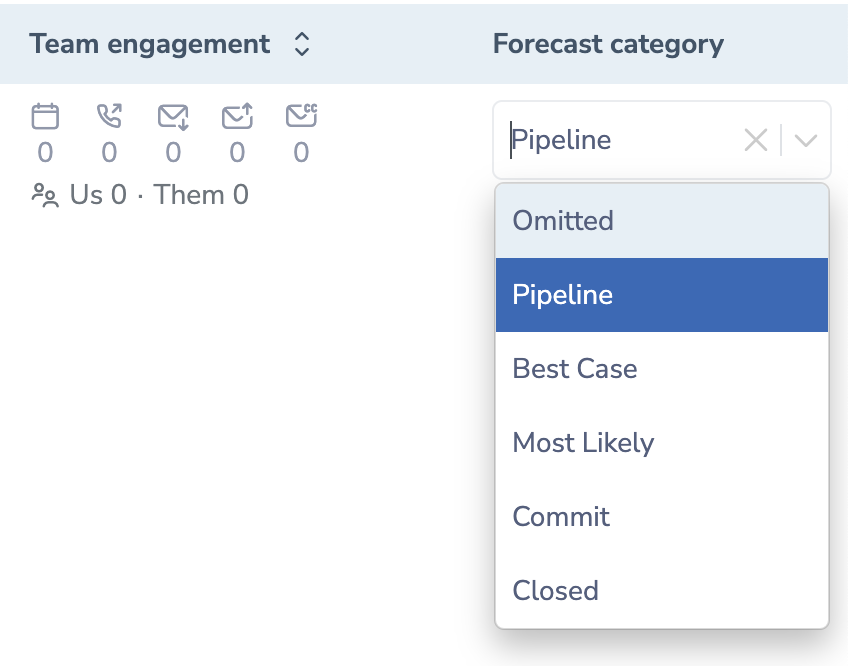 To change an Opportunity forecast category, click on the corresponding row of Forecast category column, then select the necessary option from the drop-down list.
Process signals, action items
Opportunity owners can mark signals as done or dismiss them.
If a signal requires updating a Salesforce field, sending an email, or another action:
- Click on an actionable signal
- Click on the action button in the bottom right-hand corner of the dialog
- Enter the necessary data in the new dialog that opens
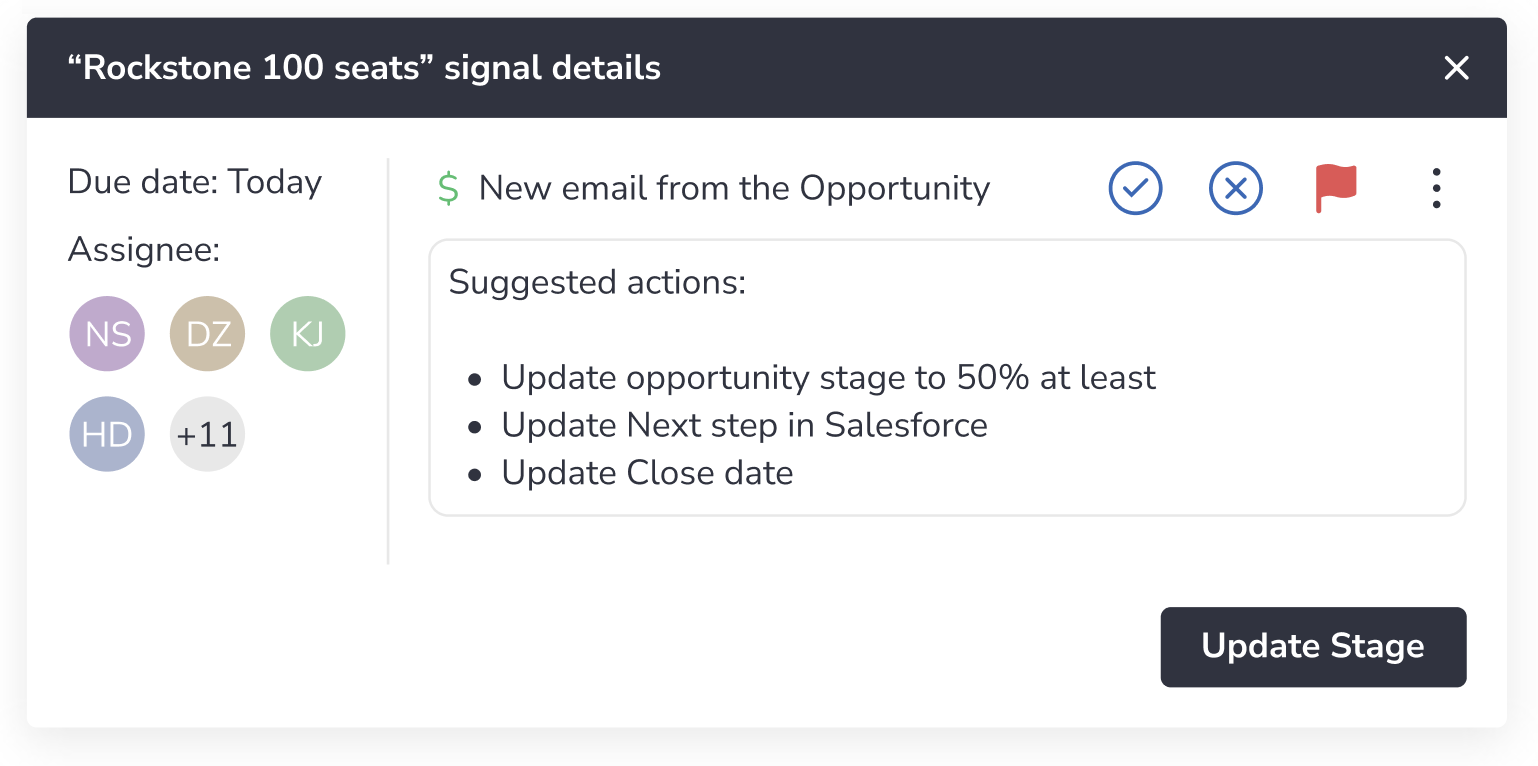
Managers can create signals, notes and action items for Opportunity owners. The created items will appear in their Signal Feed the Action Center and all assignees will be notified via MS Teams or other channels.
Mark deals with a star for better focus
Mark deals with stars to more easily identify Opportunities you are currently focusing on.
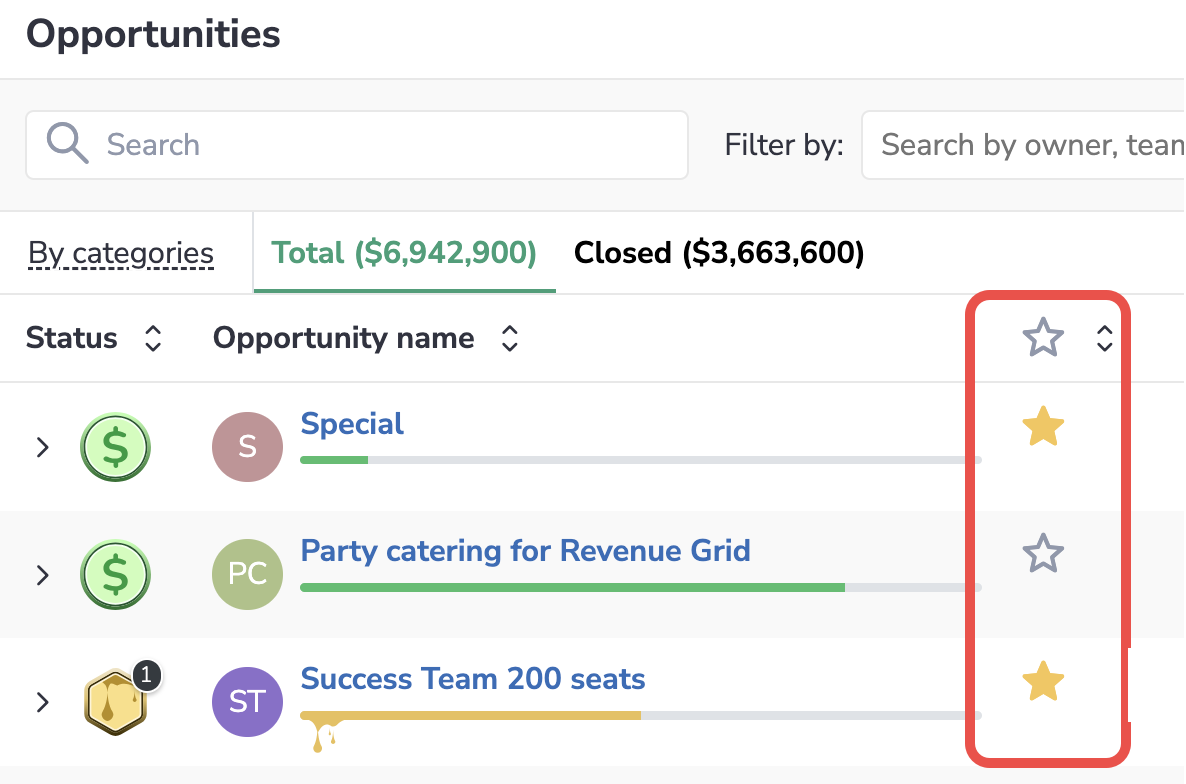
Starred deals can be helpful for planning and forecasting when you need to prioritize your efforts and consolidate resources.