Pipeline Evolution
The Pipeline Evolution report reflects how your pipeline has been developing for the selected period. It’s built based on Forecast Categories and Opportunity stage changes.
Pipeline Evolution report is being built based on Forecast Categories and Opportunity stage changes.
Specify the period
You can select the Opportunities closing period and specific dates to see the data for the period limited with the selected dates.
For example, if you want to see how Opportunities closing this fiscal quarter have changed over a specific period, select Current Fiscal Quarter in the first drop-down list and the start and end dates for the period you are interested in.

Specify the filters
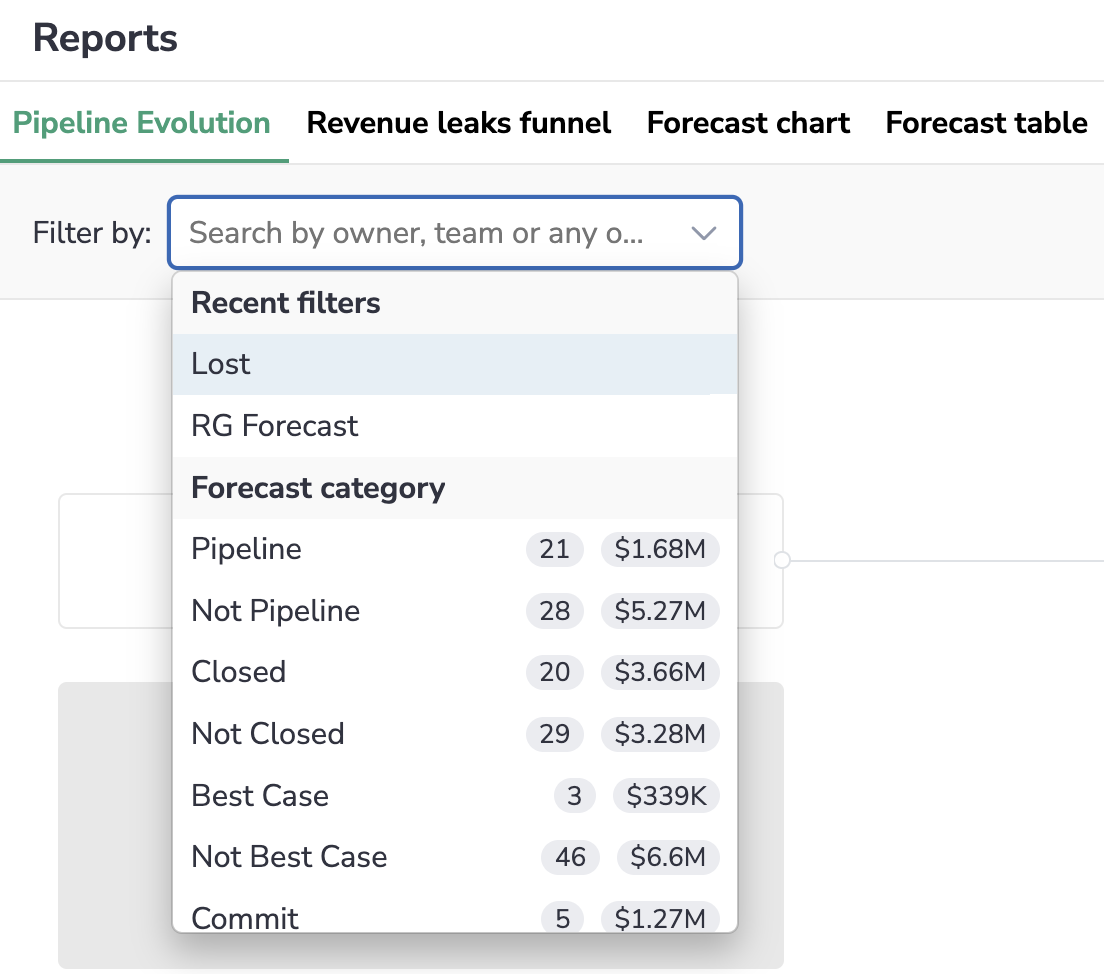
You can filter the Opportunities you see on the chart by their owner, team, forecast category, status, etc. For instance, when you have a 1-on-1 with a Sales Rep, select their name in the Filter drop-down list to see their opportunities on the chart.
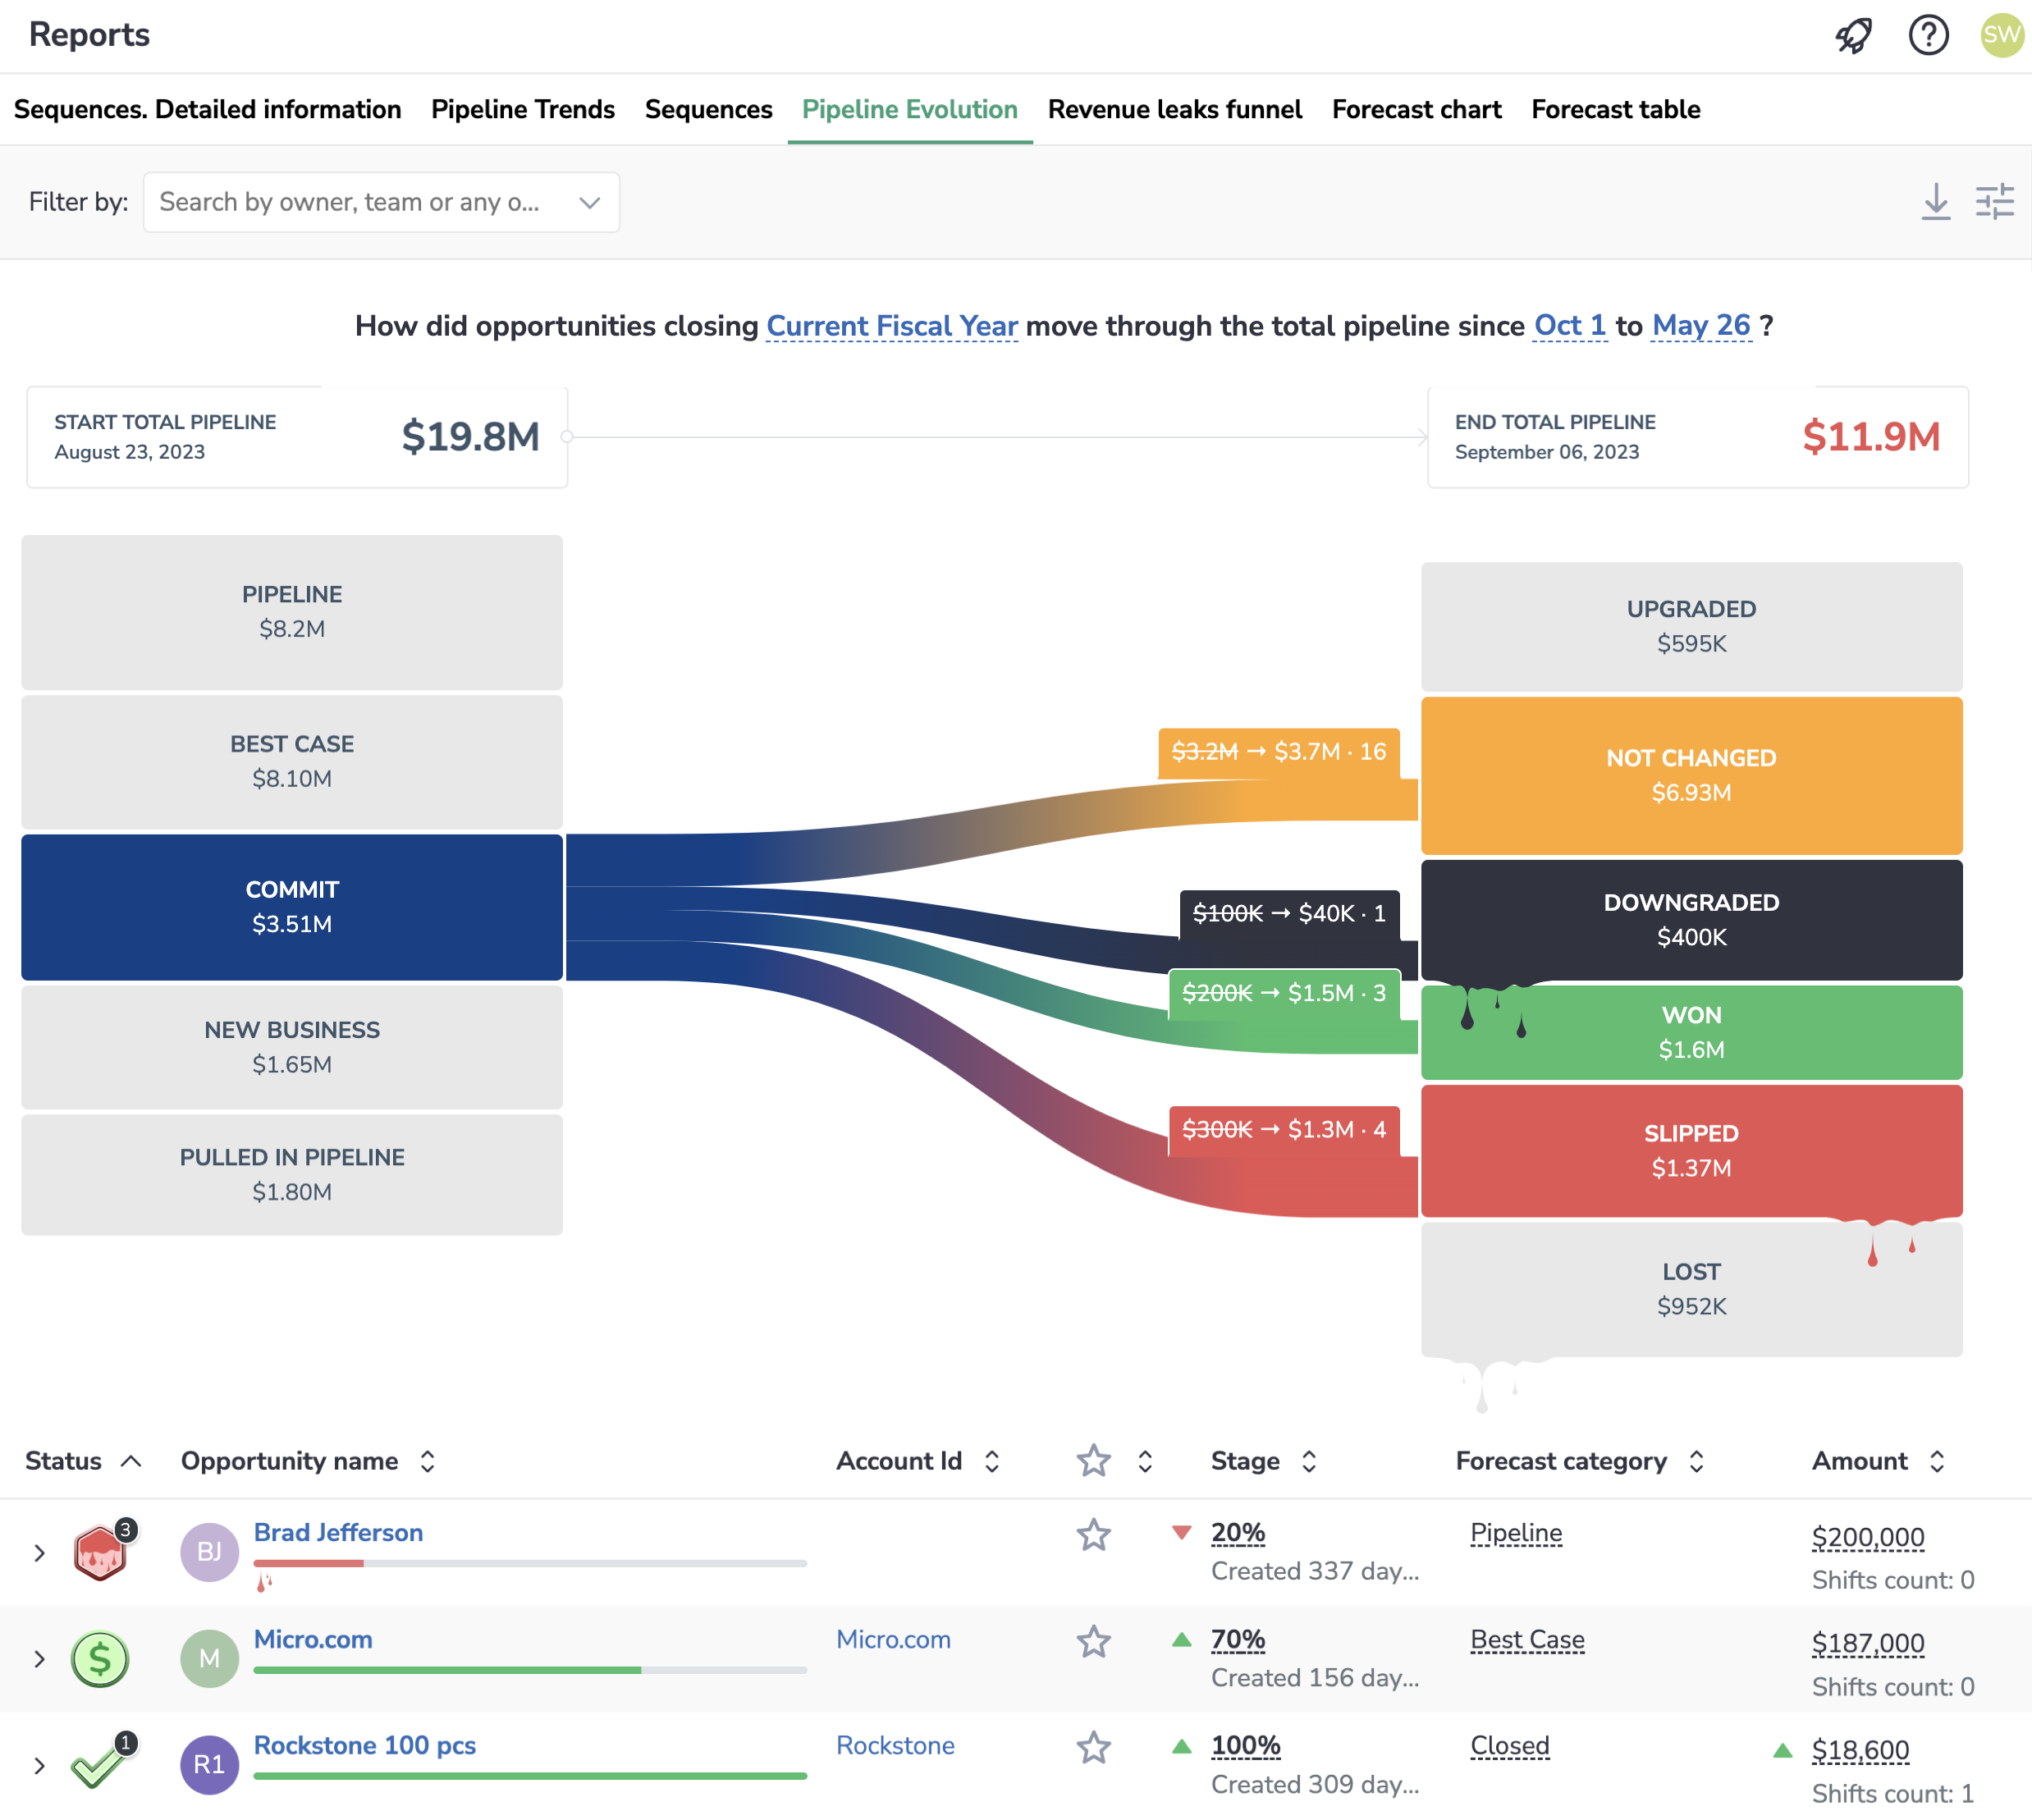
What you see on this chart
Pipeline Evolution consists of two parts:
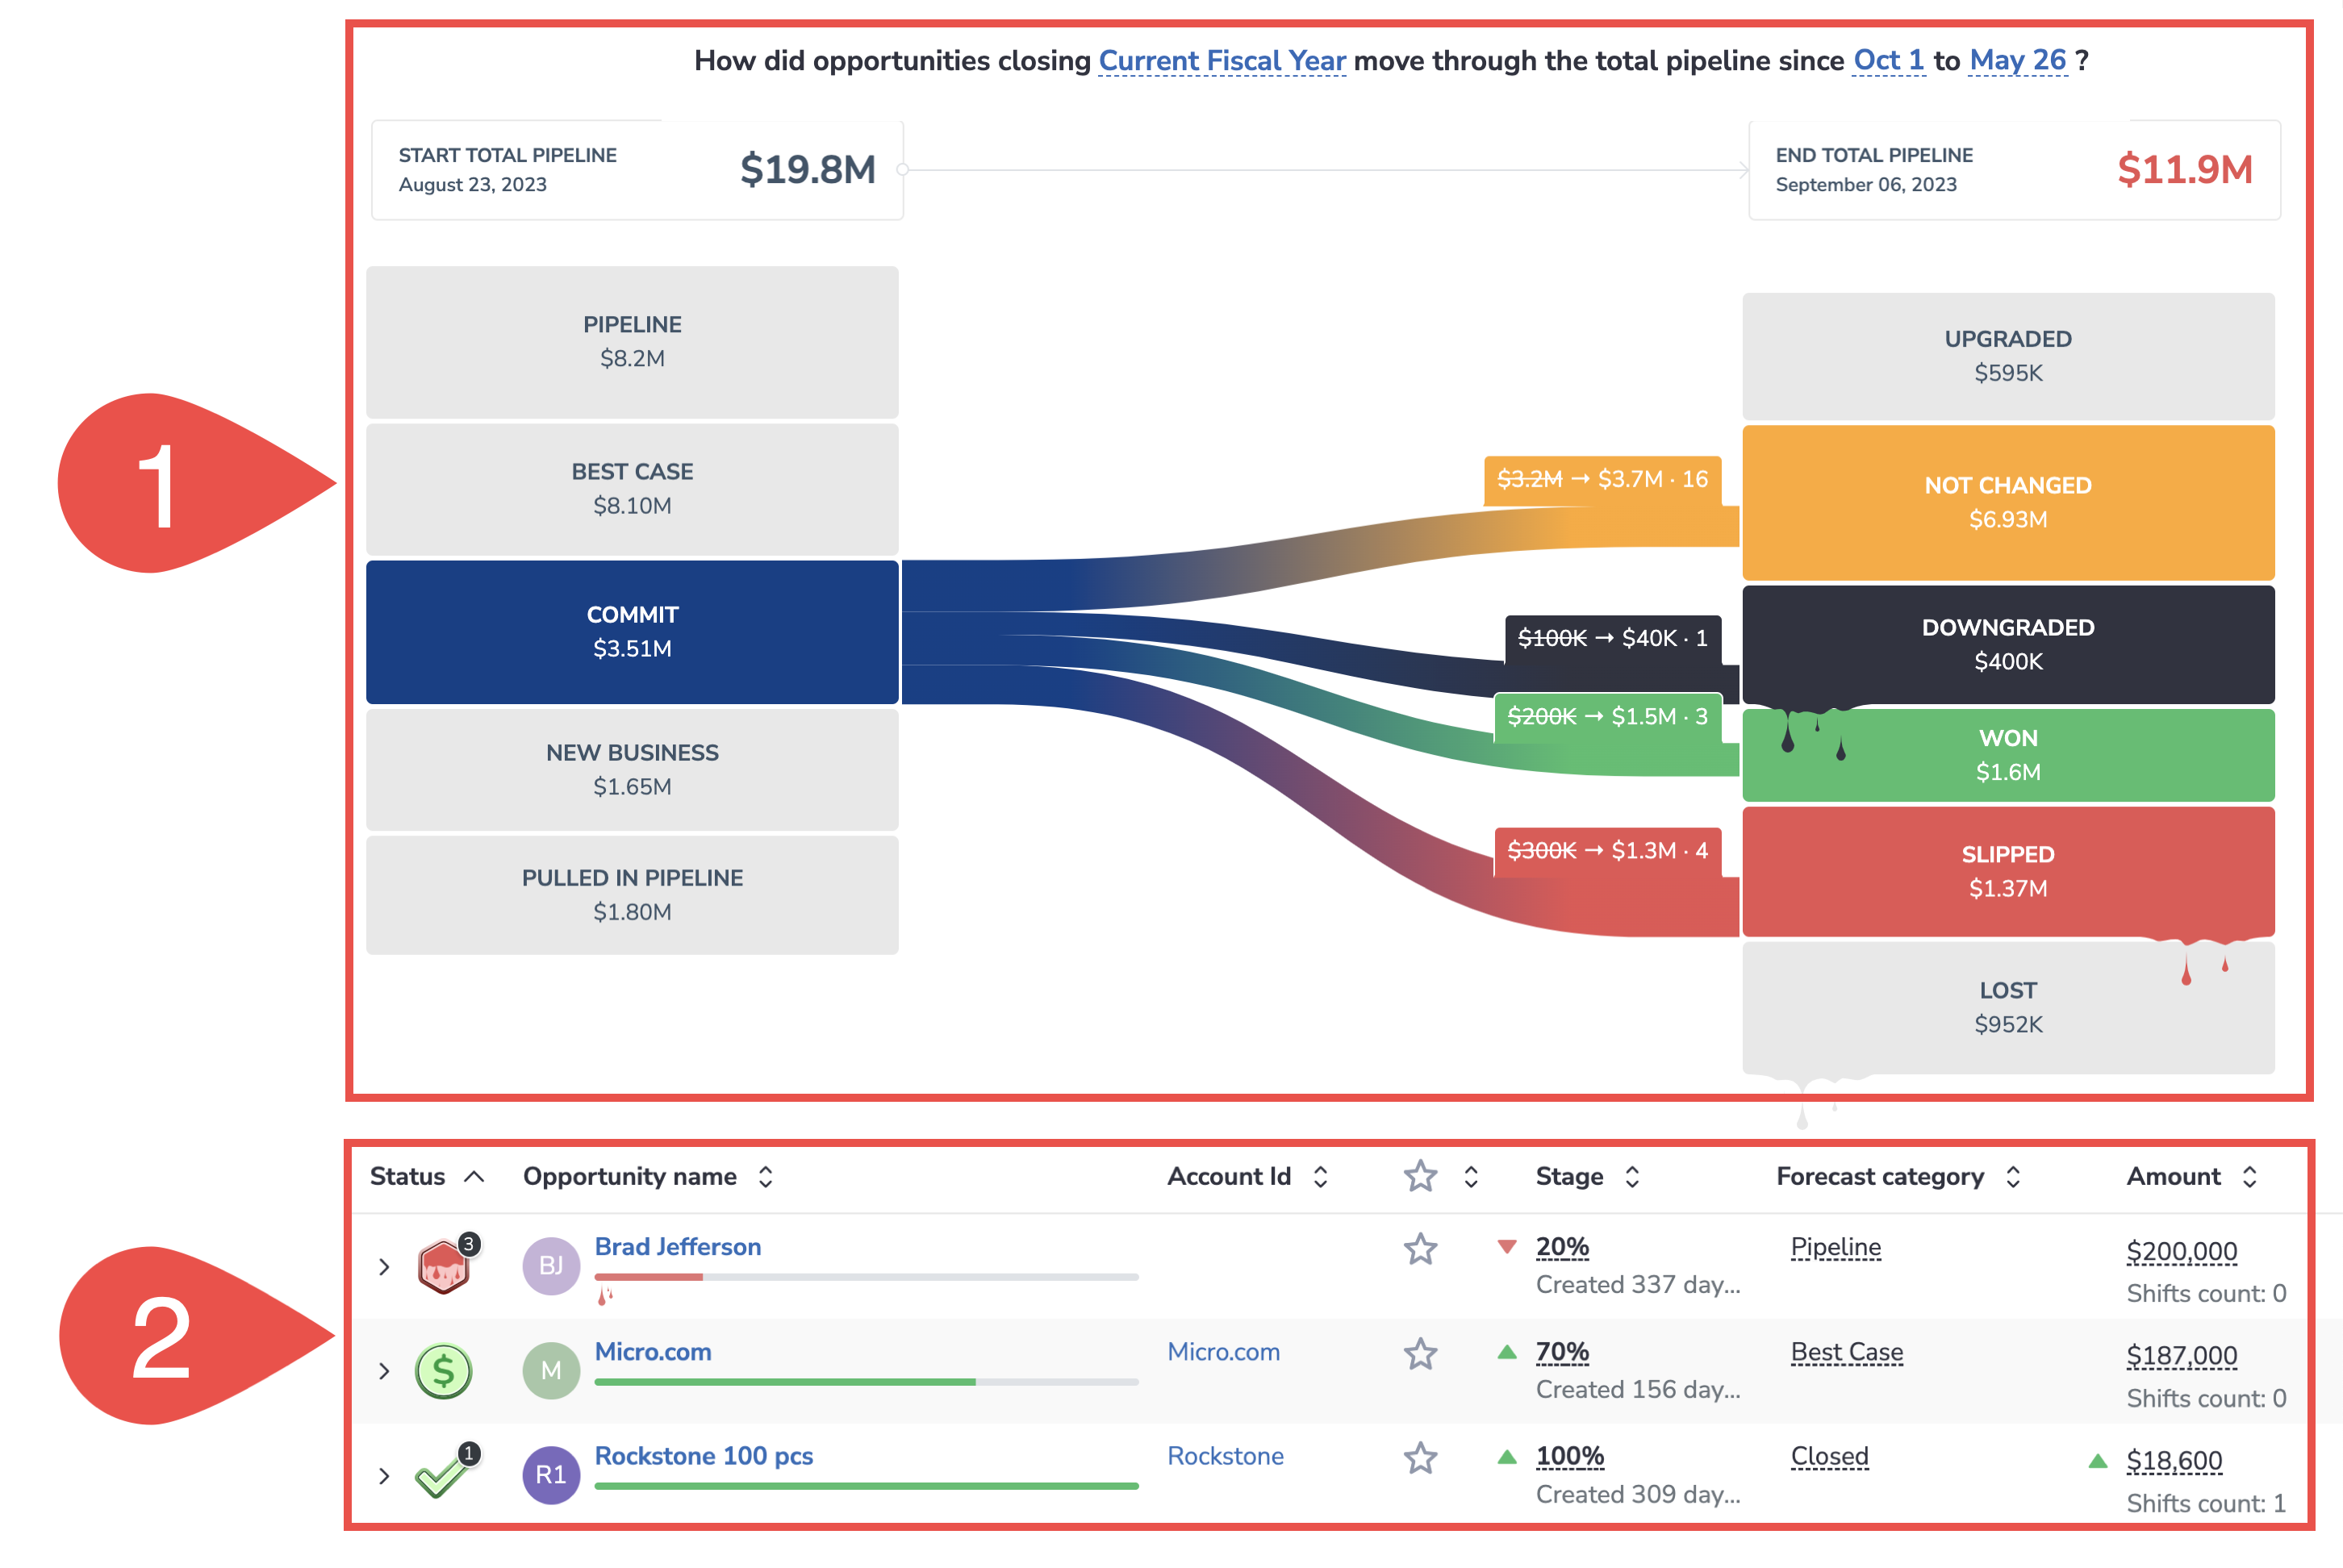
1. Visualization chart of how the deals progressed over the selected period
2. The list of Opportunities constituting the block or branch in the visualization part
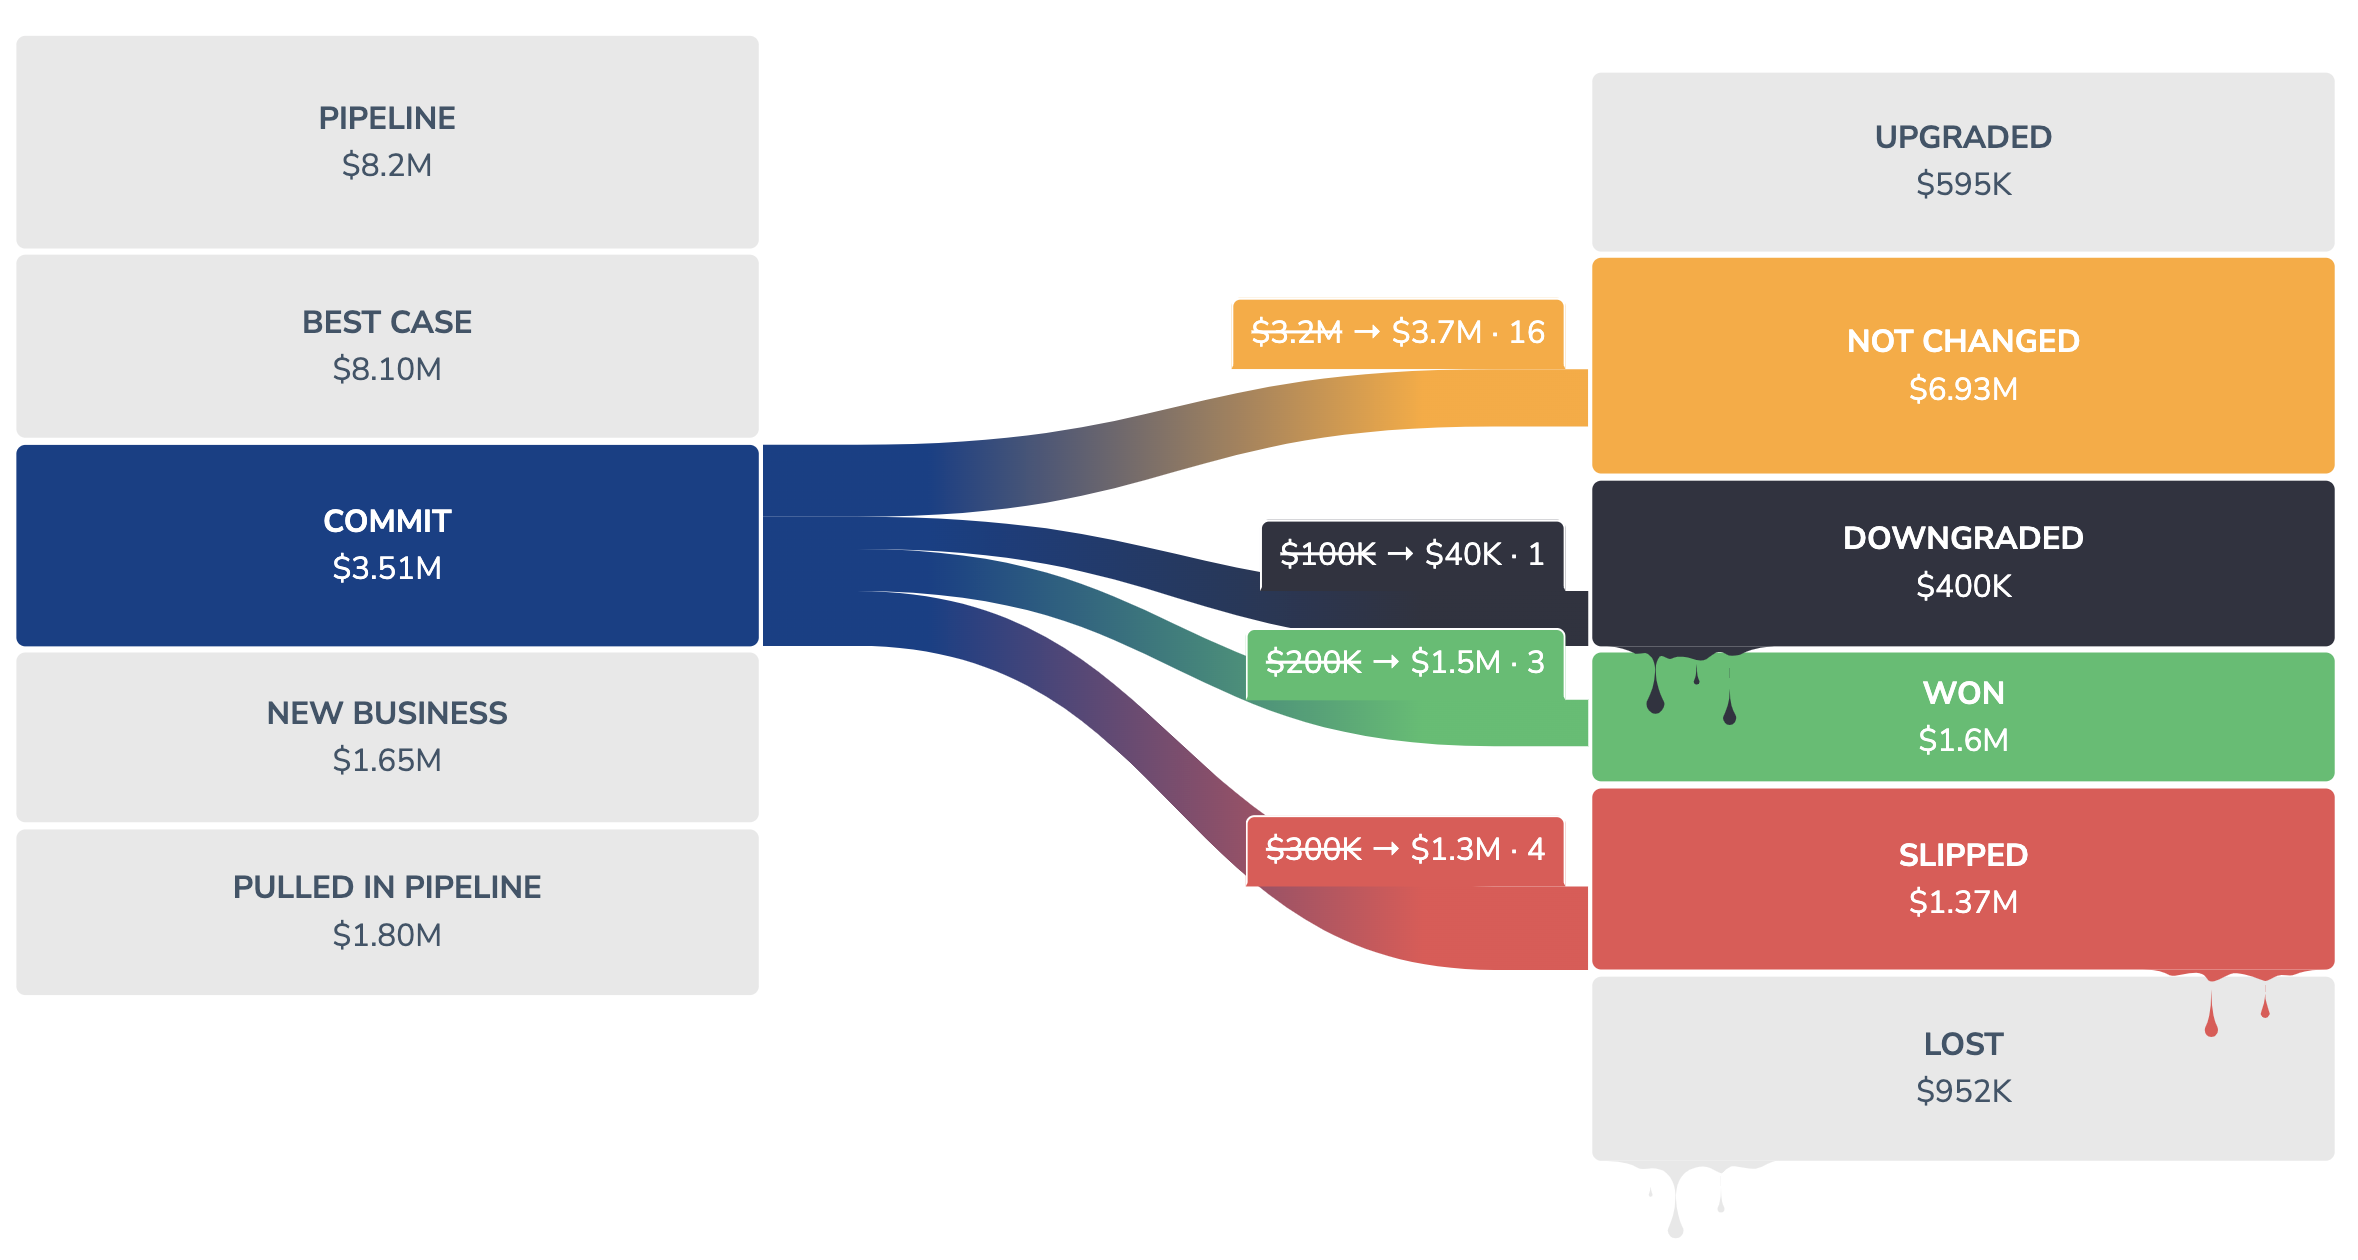
The visualization chart consists of two columns: Forecast categories and Progression categories.
Forecast categories
PIPELINE – Open deals that are on the early stages of the sales process and need further development.
BEST CASE – Deals that have work to do to advance them, though are fully qualified and have an embedded close plan.
COMMIT – Deals that are going well, and you’re confident of a successful outcome. Only in exceptional circumstances do these deals slip.
NEW – Deals that were newly added during the selected period.
PULLED IN – Deals that changed from any previous period to the selected period. For example, a deal was predicted to close in Q4, but was moved into Q3.
Progression categories
UPGRADED – Deals that progressed to a subsequent forecast category and are still open. For example, an opportunity that moved from Pipeline to Best Case falls into this category.
IDLE – Deals that remained in the same forecast category and remained open during the selected period. For example, an Opportunity that was in the Pipeline category when the selected period started and was still there when it ended falls into this category.
DOWNGRADED – Deals that regressed to a previous forecast category and are still open. For example, an Opportunity that moved from Commit to Best Case falls into this category.
WON – Deals that were won during the specified period.
LOST – Deals that were lost during the specified period.
SLIPPED – Deals that were moved from the specified period to any future period. For example, a deal was predicted to close in Q3 but was moved to Q4.
Review how the deals progressed over the selected period
-
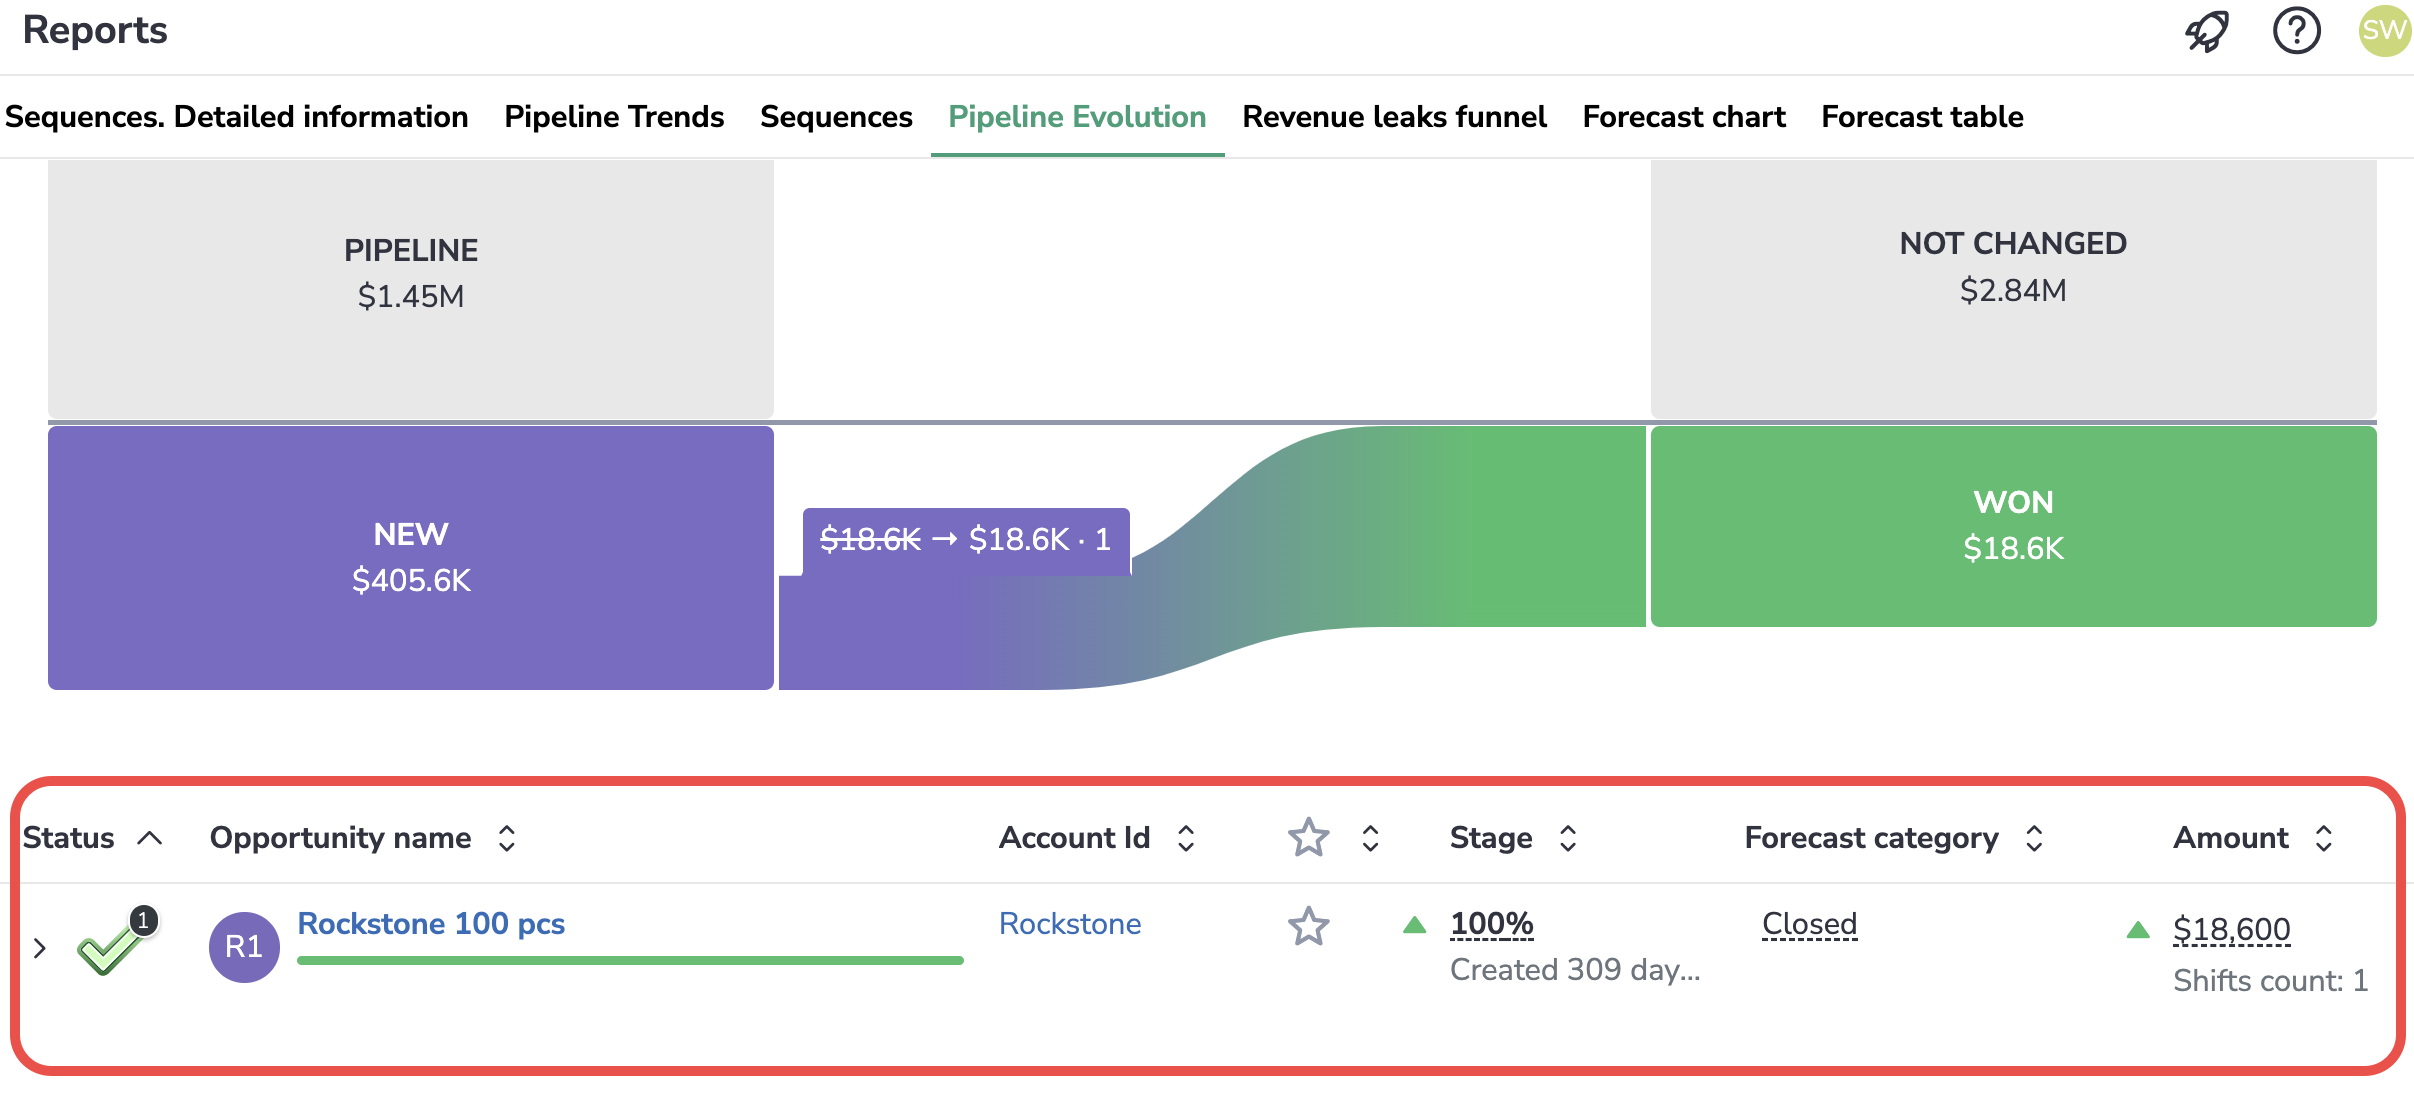
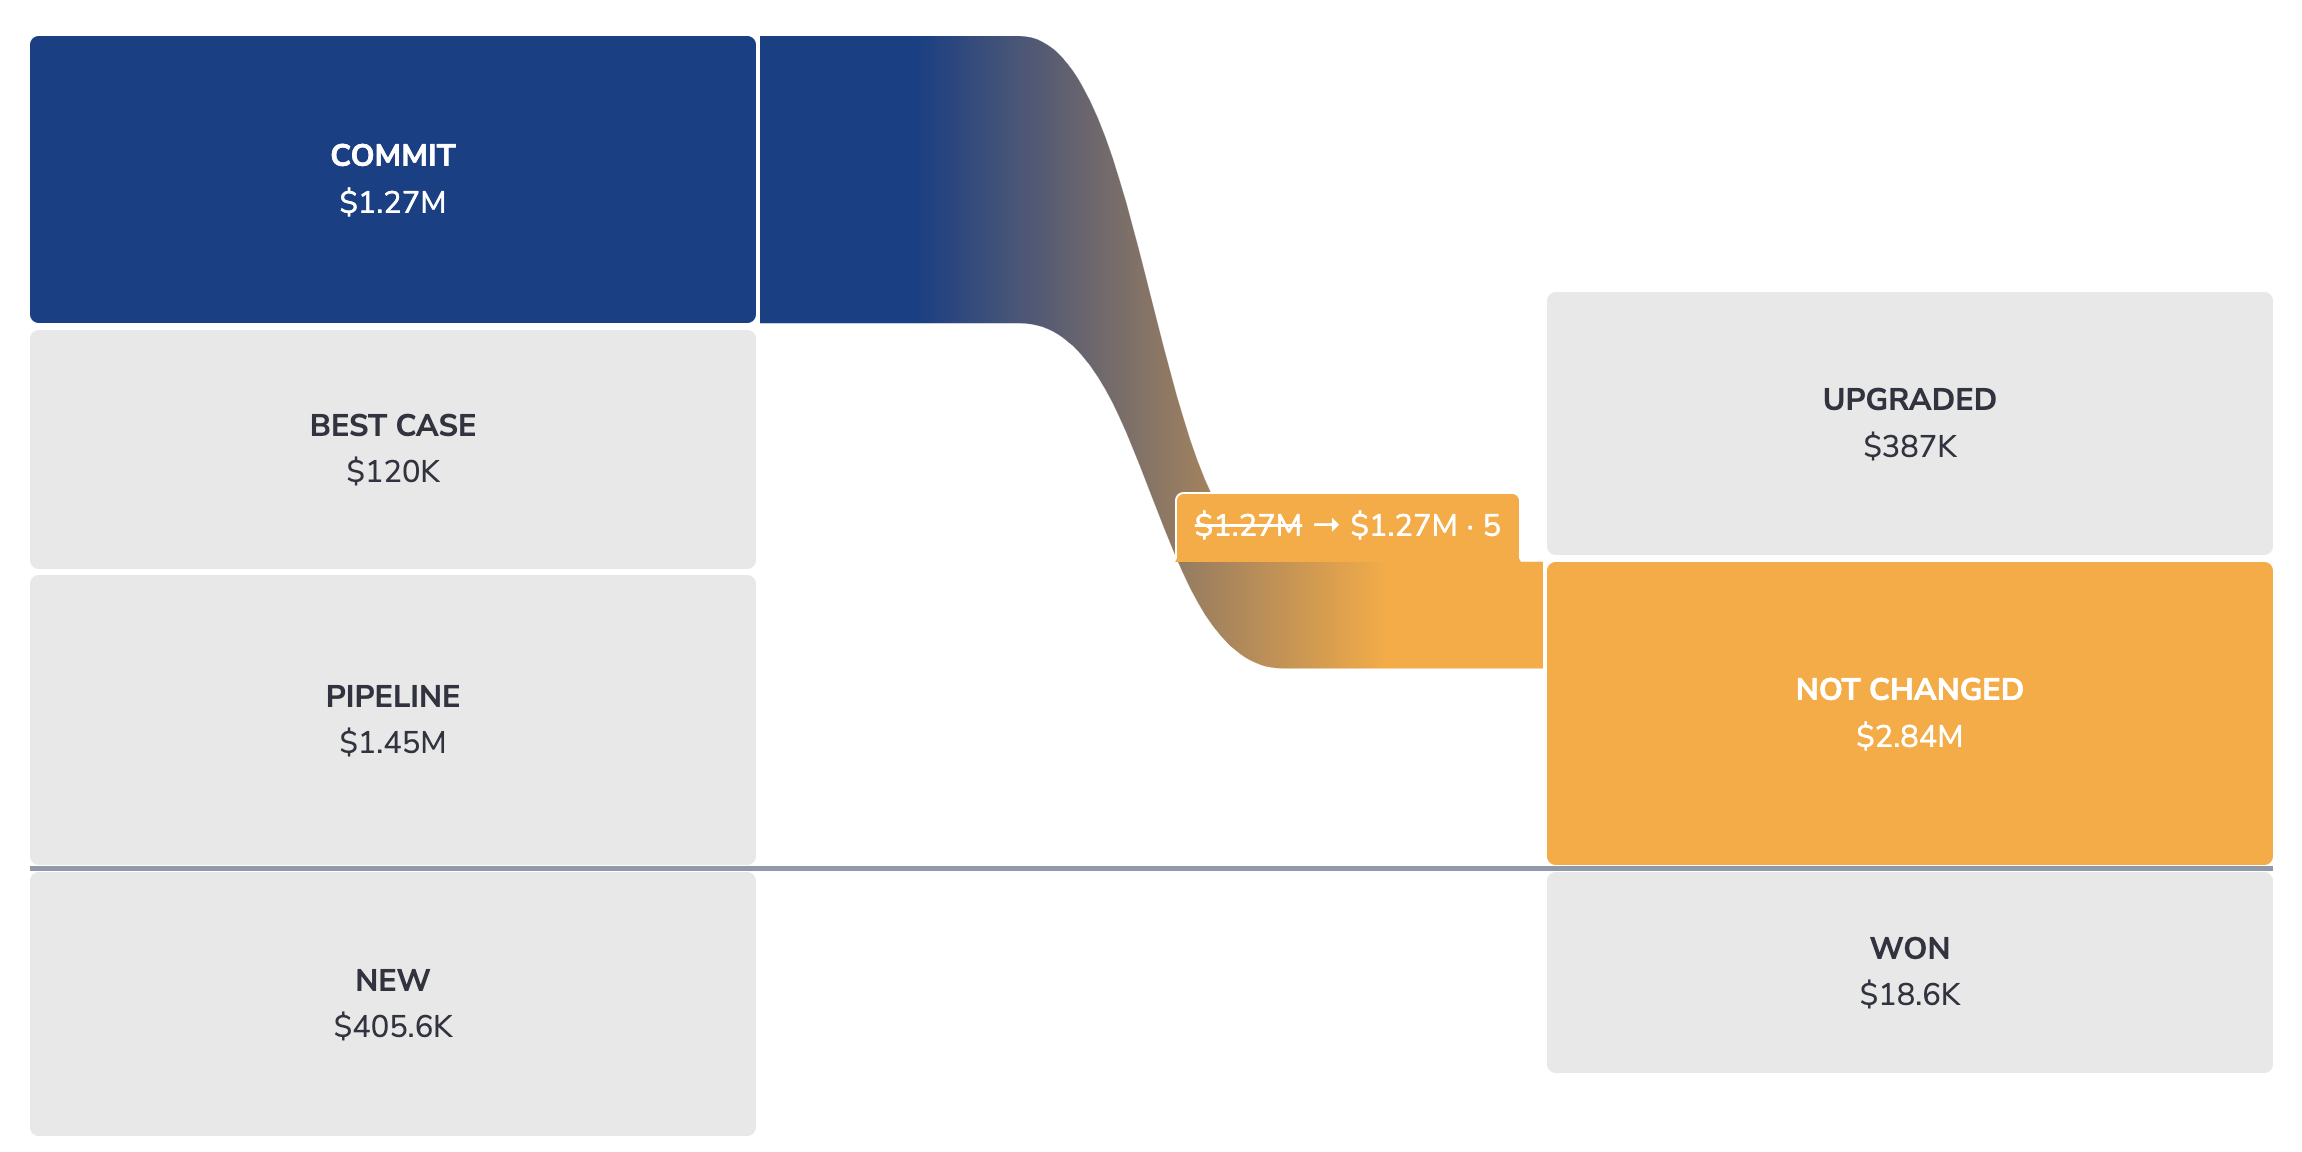
Click on any block or branch to see the list of Opps that comprise it underneath the chart.
-
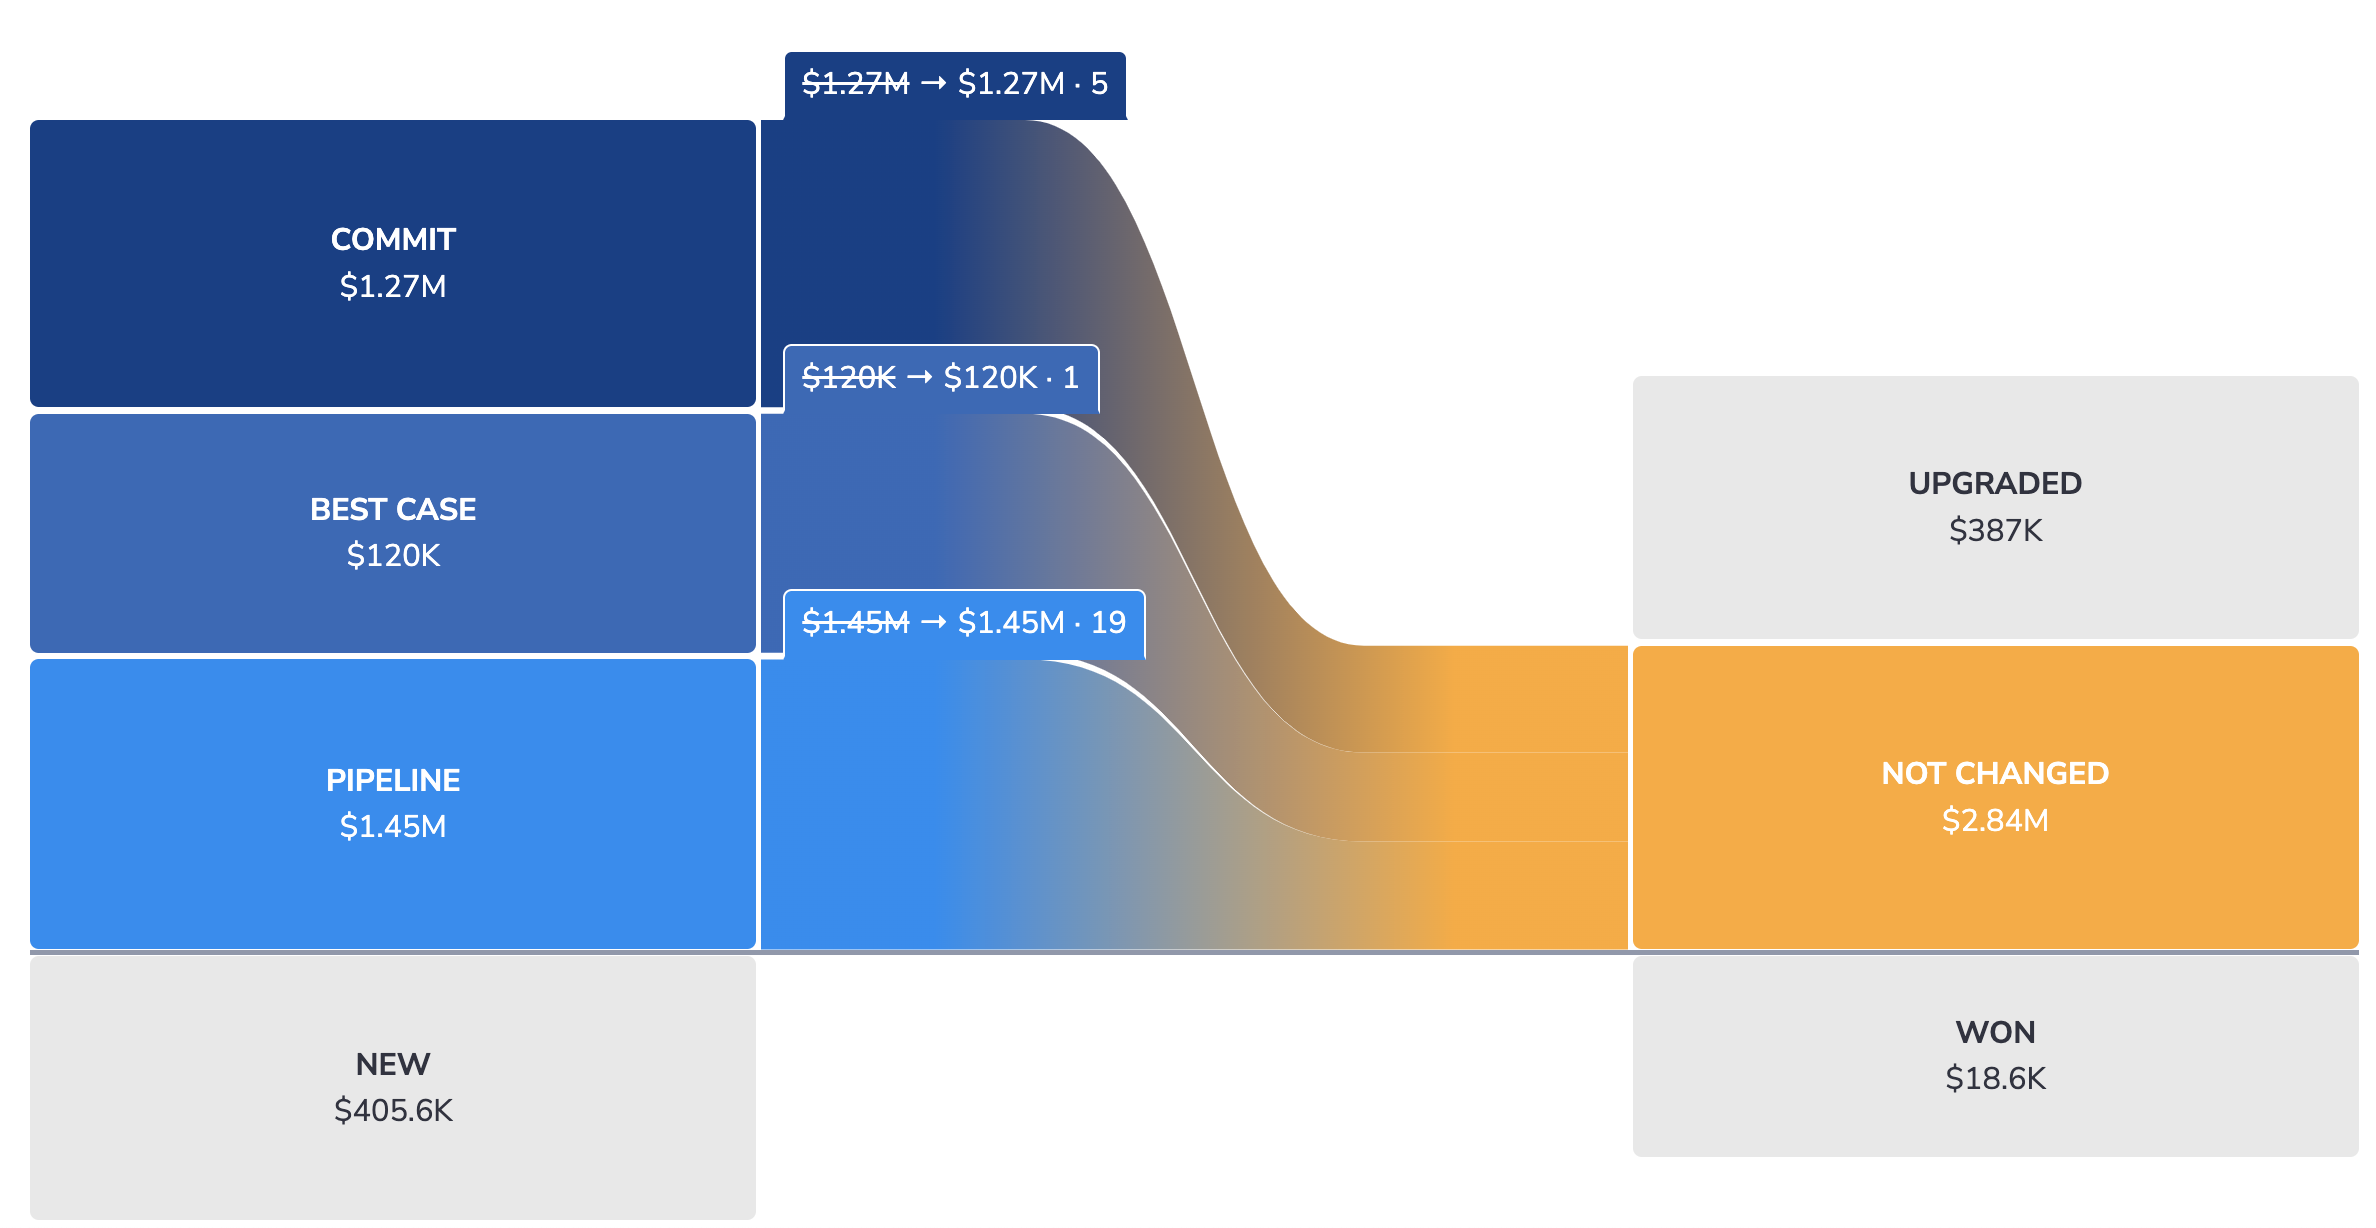
Click on any block in the left-hand column to see how Opps from the selected forecast category progressed.
-
Click on any block in the right-hand column to see the forecast categories to which the Opps belonged when the specified period started.
-
Click on a branch connecting two blocks to see the list of Opps in the linked forecast and progression categories.
Conveniently track the sum changes
See how the sums of deals in each category changed over the selected period.
