More Effective Sales Projecting with Revenue Grid’s Forecast
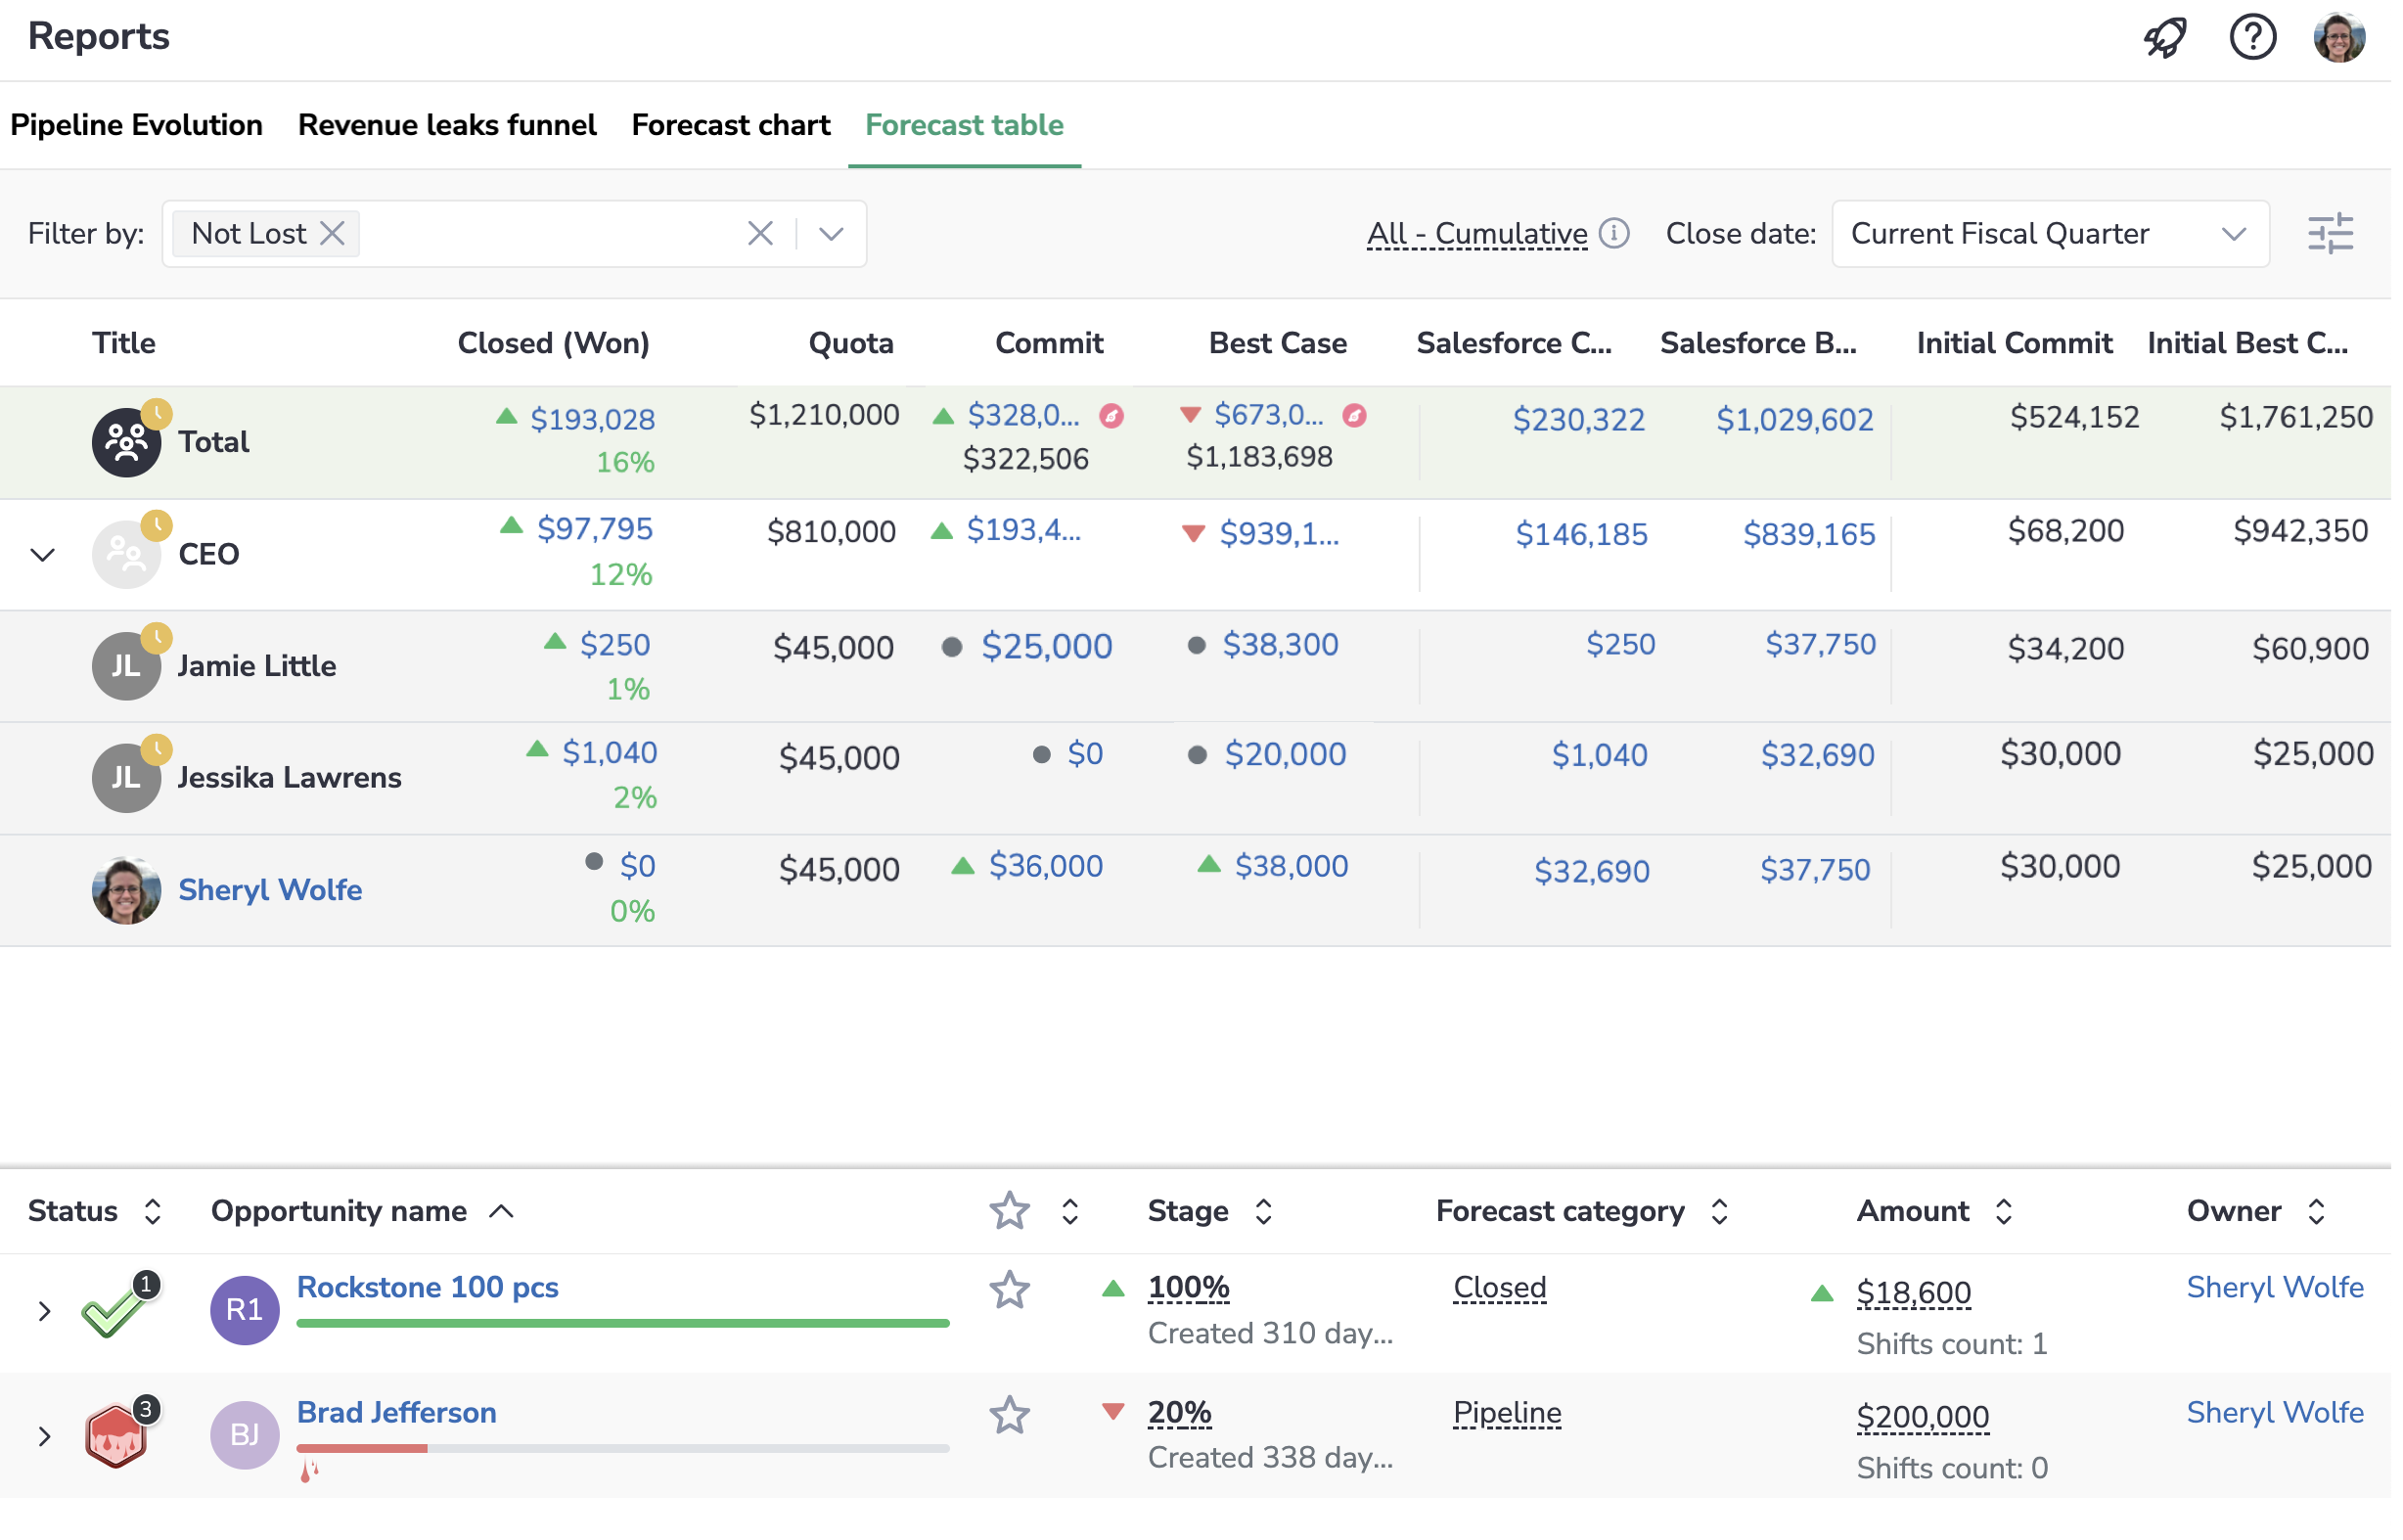
The Forecast table lists users and teams involved in the sales process, their Salesforce data, and adjusted forecasts. It’s intended to ensure better visibility of the sales process and more accurate customized forecasting.
Forecast is built based on your company’s Salesforce data, such as Quota, Best Case, and Commit. It also includes the adjusted Commit and Best Case forecasts manually submitted by the users in Revenue Grid.
In this way, managers can see the sales statistics and customized projections for the selected period and efficiently monitor how the numbers change over the selected period and the performance of each employee.
Figures in Forecast
Note
Note that if your Org has multiple currencies enabled in Salesforce, all figures are converted into the corporate currency (learn about managing corporate currency in this article). However, when you open a specific Opp, its sum is displayed in its actual currency.
This report combines the sales statistics and forecast from Salesforce and the customized numbers manually submitted by the Sales Reps.
Retrieved from Salesforce
Revenue Grid retrieves the basic figures from Salesforce and uses them as a base line for the customized projections.
Quota is the Salesforce Quota for the selected period.
Closed (Won) is the sum of the Opportunities amounts that were closed won in the selected period.
Salesforce Commit is the Commit specified in Salesforce for the selected period.
Best Case is the Best Case specified in Salesforce for the selected period.
Adjusted in Revenue Grid
If a Sales Rep realizes that their actual figures in the specific period will differ from the figures in Salesforce, they can adjust their forecast to ensure that their managers see it as well.
Best Case is the latest adjusted Best Case submitted in Revenue Grid.
Commit is the latest adjusted Commit submitted in Revenue Grid.
Initial Commit is the first Adjusted Commit submitted in the selected period.
Initial Best Case is the first Adjusted Best Case submitted in the selected period.
Note is the note added on submitting the latest Adjusted Commit/Best Case forecast.
Forecast Last Submitted is the date when the forecast was last submitted.
Closed Won Last Week is the sum of Opportunities that were closed won within the last 6 days. If today is Wednesday, you'll see the total amount for the period from last Thursday through today.
This Week Projected is the sum of Opportunities that are projected to close within 7 days starting from your org's first weekday.
Next Week Projected is the sum of Opportunities that are projected to close within the next 7 days starting from tomorrow.
Monitor the changes in forecast
In Forecast, you can monitor how your team’s forecast changed using the color indicators:
![]() Green icon means a positive change of the forecast, i.e., increase in amount.
Green icon means a positive change of the forecast, i.e., increase in amount.
![]() Red icon means a negative change of the forecast, i.e., decrease in amount.
Red icon means a negative change of the forecast, i.e., decrease in amount.
To see when the forecast was changed, hover over the necessary figure.
Assess gap to Quota and pipeline coverage
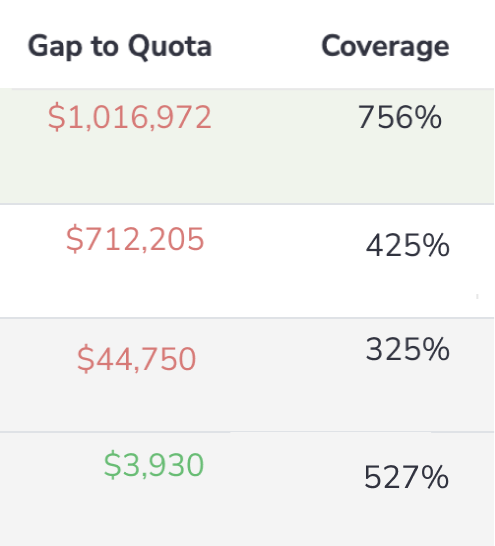 Use these indicators to evaluate your sales process more effectively and adjust your strategies accordingly.
Gap to Quota is the difference between the Quota and the generated revenue.
Pipeline Coverage ratio is the ratio between the total value of all Opportunities (Pipeline, Best Case, Commit, and Won) and the Quota.
All Opportunity details in one report
Click on any number to see the detailed information about the Opportunities that comprise it.
Customize the view
 Select the columns to be displayed in the Forecast table.
 Apply the necessary filters to find the most relevant results.
Select forecast type to display the Opportunities
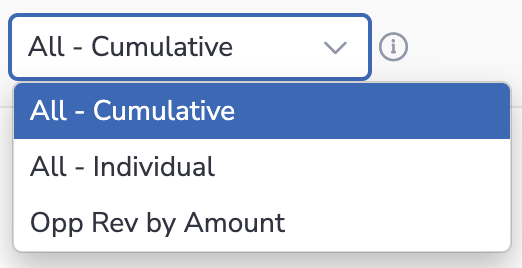
If your company uses Forecast types, select any of them in the drop-down list next to the Close date field. You will only see the Opportunities that belong to the selected forecast type.
By default, Opportunities from all forecast types are displayed on this page (All - Cumulative), but you can select any Opportunity-based forecast type in the upper-right part of this page.
Learn about setting up forecast types in Salesforce…
How to adjust the Best Case and Commit forecasts
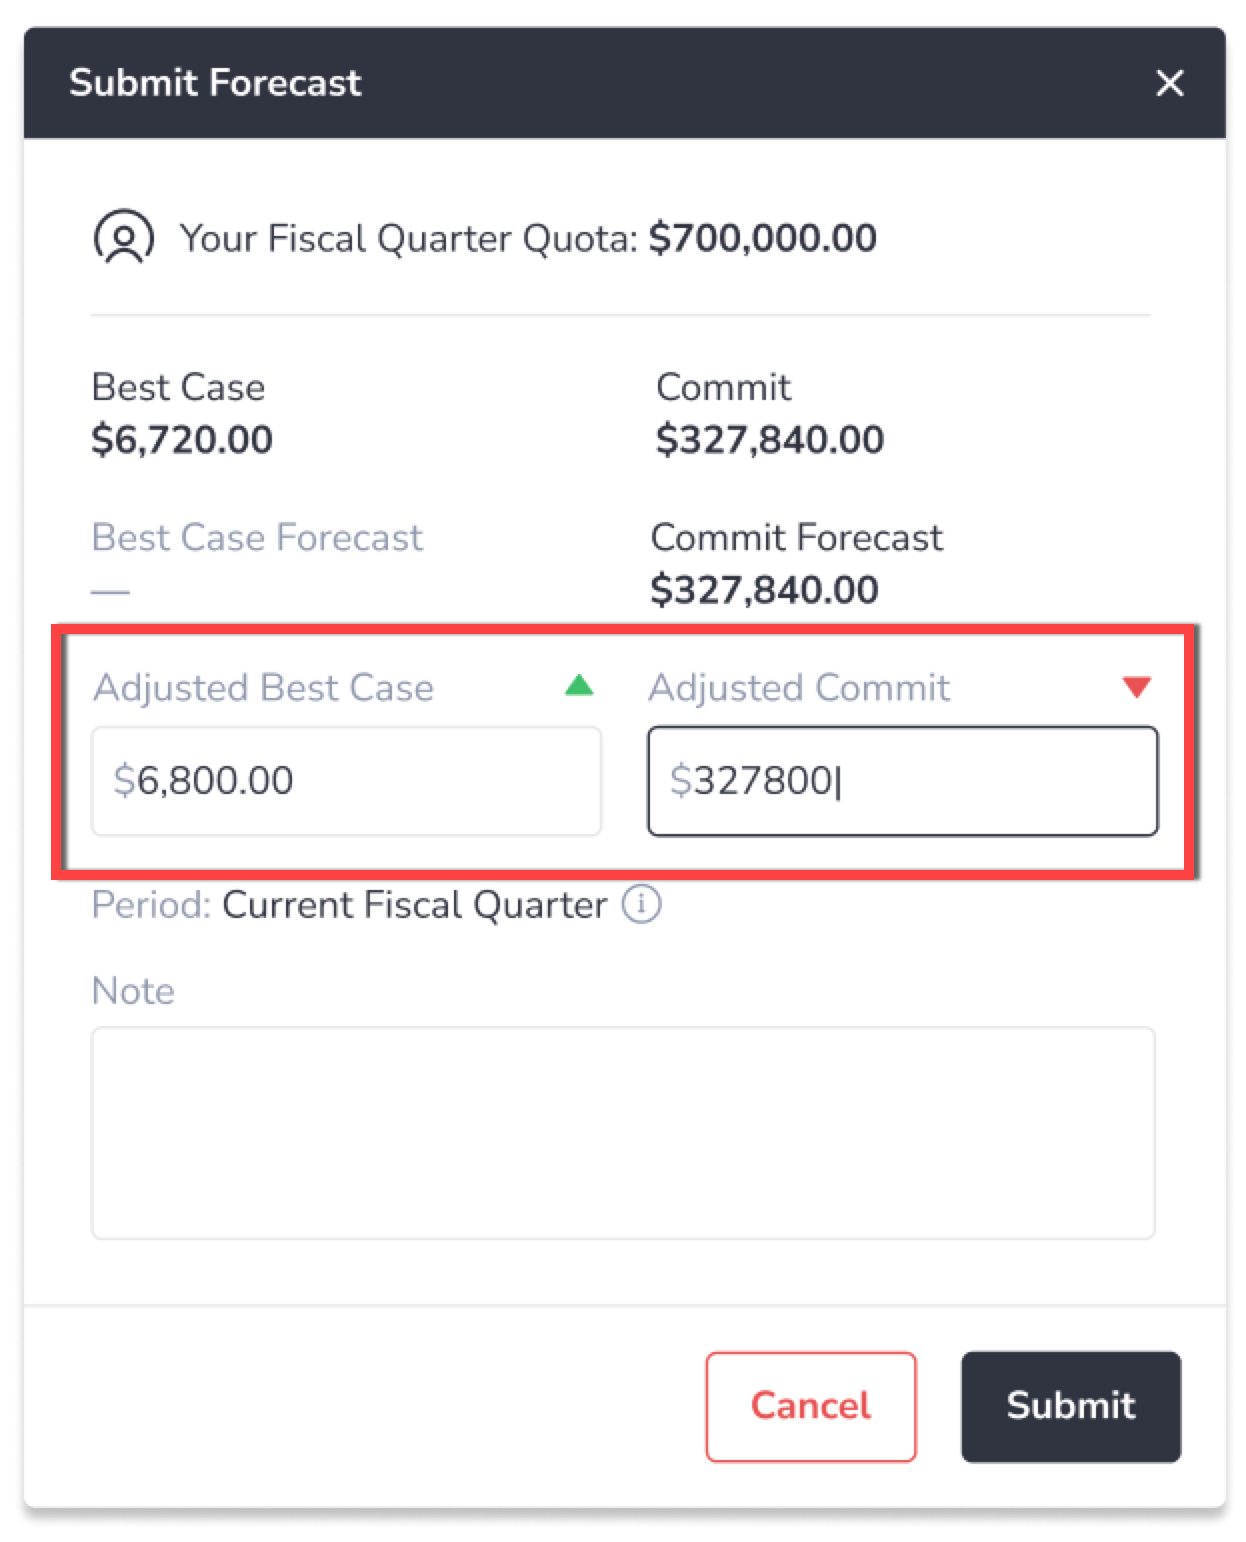
If a Sales Rep realizes that their Best Case and Commit forecasts for the current quarter will differ from the ones calculated by Salesforce, they can adjust their personal sales forecast to include it in the org-wide forecasting.
- To adjust the forecast, click on your profile picture and go to My profile
- Click
 .
. - In the dialog box, enter the necessary adjusted Best Case and Commit values in the corresponding fields. This dialog also includes your current quota, Best Case and Commit calculated by Salesforce, the adjusted Best Case and Commit you submitted previously.
- Click Submit to save the changes. The updated numbers will be displayed on the top of the page and in Forecast.